Untreated Sleep Apnea: Does It Get Worse?
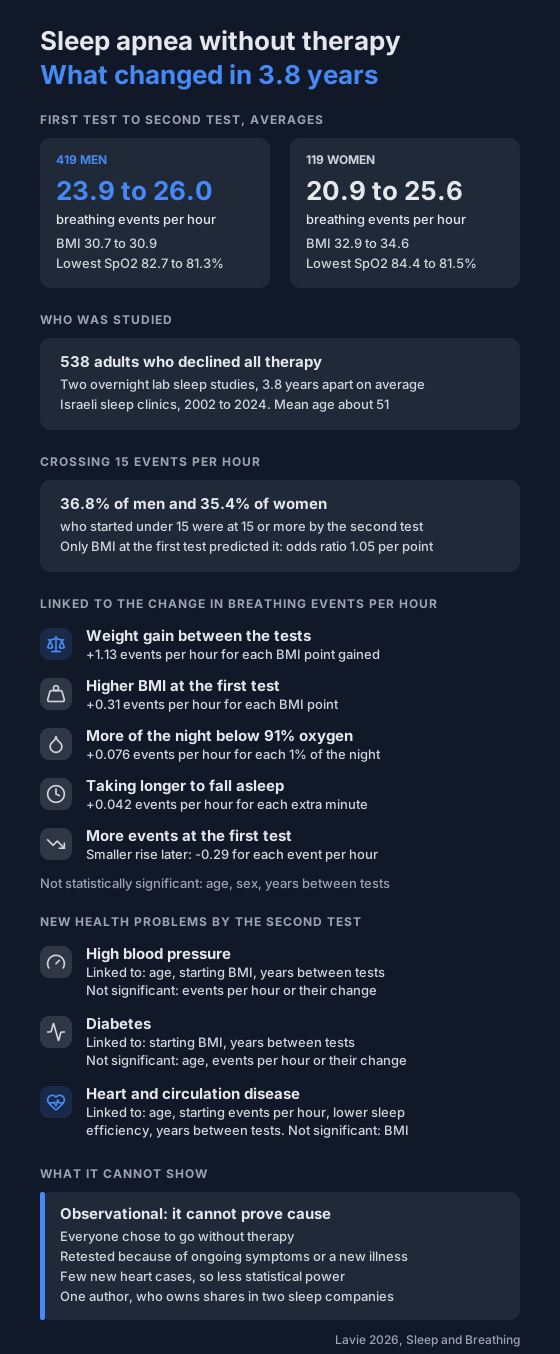
A 2026 study retested 538 adults who declined sleep apnea therapy about 3.8 years later. Breathing events per hour went up on average, and weight gain was linked to a bigger rise.
Plenty of people are told they have sleep apnea and decide not to start therapy. What happens to them over the next few years isn't well understood.
A 2026 study from Israel looked at 538 adults who declined, and who had a second overnight sleep study about 3.8 years after the first. On average their breathing events per hour went up. People who gained weight between the tests had a bigger rise. Everyone in it was retested because symptoms continued or a new health problem turned up, so it describes that group, not everyone who goes without therapy.
Who was studied?
- 538 adults: 419 men and 119 women, with a mean age at the first test of 50.6 for men and 51.5 for women.
- All were referred to the Technion Sleep Disorders Center clinics for fatigue, loud snoring or pauses in breathing seen by someone else.
- All declined therapy. None used CPAP or an oral appliance, even for a trial, and none had throat or weight-loss surgery.
- Each had two overnight sleep studies in a lab, 3.8 years apart on average, scored the same way.
- They had the second one because their symptoms continued or a new health problem turned up.
- New high blood pressure, diabetes and heart or circulation disease were taken from their medical records.
It's a retrospective study: the author went back through clinic records from 2002 to 2024.
Did it get worse?
On average in this group, yes. These are the averages at the first and second test, from the paper's Table 1:
| Men, first | Men, second | Women, first | Women, second | |
|---|---|---|---|---|
| Breathing events per hour | 23.9 | 26.0 | 20.9 | 25.6 |
| BMI | 30.7 | 30.9 | 32.9 | 34.6 |
| Lowest overnight SpO2 | 82.7% | 81.3% | 84.4% | 81.5% |
All of those changes were statistically significant. The share of the night spent below 91% oxygen didn't change significantly.
Some people crossed a threshold:
- Of those who started under 15 events per hour, 36.8% of men (49) and 35.4% of women (17 of 48) were at 15 or more by the second test.
- Of those who started under 30, 19.1% of men (58 of 304) and 14.4% of women (14 of 97) were at 30 or more.
The averages hide a spread. The paper doesn't report how many people's event counts stayed the same or went down.
For the wider research on this, see how sleep apnea changes over time.
What predicted a bigger rise?
The study modelled the change in breathing events per hour against age, sex, weight and sleep measures. Four things were independently linked to a bigger rise:
- Weight gain between the tests. Each BMI point gained went with 1.13 more events per hour.
- A higher BMI at the first test. 0.31 more events per hour for each BMI point.
- More of the night below 91% oxygen at the first test. 0.076 more events per hour for each extra 1% of the night.
- Taking longer to fall asleep at the first test. 0.042 more events per hour for each extra minute.
People with more events at the first test had a smaller rise later, 0.29 fewer for each event per hour they started with. The author says that fits regression to the mean: a high first reading tends to be followed by one closer to average.
Age, sex, the number of years between the tests, sleep efficiency and total sleep time had no statistically significant link with the change.
When the question was only "who crossed 15, or 30, events per hour?", BMI at the first test was the only predictor. The odds ratios were 1.05 for crossing 15 and 1.06 for crossing 30, per BMI point. The author's point is that a threshold can miss gradual change that the raw number shows.
What about blood pressure, diabetes and heart disease?
By the second test, new cases had been recorded in people who didn't have the condition at the first:
- High blood pressure: 46 men and 13 women.
- Diabetes: 30 men and 12 women.
- Heart and circulation disease: fewer. The most common was angina, in 18 men and 2 women.
What each one was linked to, after adjusting for the other factors:
- High blood pressure. Older age (odds ratio 1.05 per year), a higher BMI at the first test (1.09 per point) and more years between tests (1.29 per year). No statistically significant link with breathing events per hour or how much they changed.
- Diabetes. A higher BMI at the first test (1.15 per point) and more years between tests (1.24 per year). No statistically significant link with age, breathing events or their change, in the paper's Table 7.
- Heart and circulation disease. Older age (1.05 per year), more breathing events per hour at the first test (1.03 per event), lower sleep efficiency (0.96 for each extra percentage point) and more years between tests (1.15 per year). No statistically significant link with BMI.
Sleep efficiency is the share of time in bed spent asleep.
The paper says swapping breathing events for oxygen measures didn't change these results. A different paper found that time at low oxygen was a stronger predictor of heart events than the event count.
What can't it show?
Limitations the author states:
- Cause. It's observational, so it shows what went together, not what caused what.
- Small numbers for heart outcomes. There were few new heart cases, which limits statistical power.
- Selection. Everyone chose to go without therapy, so the results may not apply to people who accept it.
- Lifestyle. Changes other than weight, such as exercise or medication, weren't recorded.
Things we noticed:
- People had the second test because their symptoms continued or a new health problem turned up. People who felt fine and never came back aren't in the data, so the group may lean toward those who got worse.
- There was no comparison group on therapy.
- The text says 49 of 144 men crossed 15 events per hour, but the paper's Table 2 has 133 men under 15 at the start, and 36.8% matches 133.
- The text gives the women's average rise as 3.86 events per hour, but the table's averages differ by 4.75 (worked out from Table 1).
- The abstract and one sentence in the results say age was linked to new diabetes, but the paper's Table 7 gives an odds ratio of 1.01 per year, which is not statistically significant. We used the table.
- The paper gives percentages for new cases that don't share one denominator, so we report the counts only.
Funding and conflicts: the paper lists only open access funding from the Technion. It has a single author, who declares owning shares in SLP Ltd and the Technion Sleep Center Ltd.
What can you do with this?
These are our suggestions, not the study's findings.
- One sleep study is a single point in time. If yours was years ago and your weight has changed, ask your doctor whether a re-check makes sense.
- Whether to start therapy is a decision for you and your doctor.
- An overnight oximeter can't tell you whether you have sleep apnea or whether it has changed. It can log your overnight oxygen over months, including time below 90%, and you can share that with your doctor.
Not a medical device. Does not diagnose, treat or prevent any condition. Discuss results and changes with a clinician.
References
- Lavie P. Predicting sleep apnea worsening and cardiometabolic risk without treatment. Sleep and Breathing. 2026;30(2):131. doi:10.1007/s11325-026-03617-y