Time Below 90% in Sleep Apnea: Who Has More?
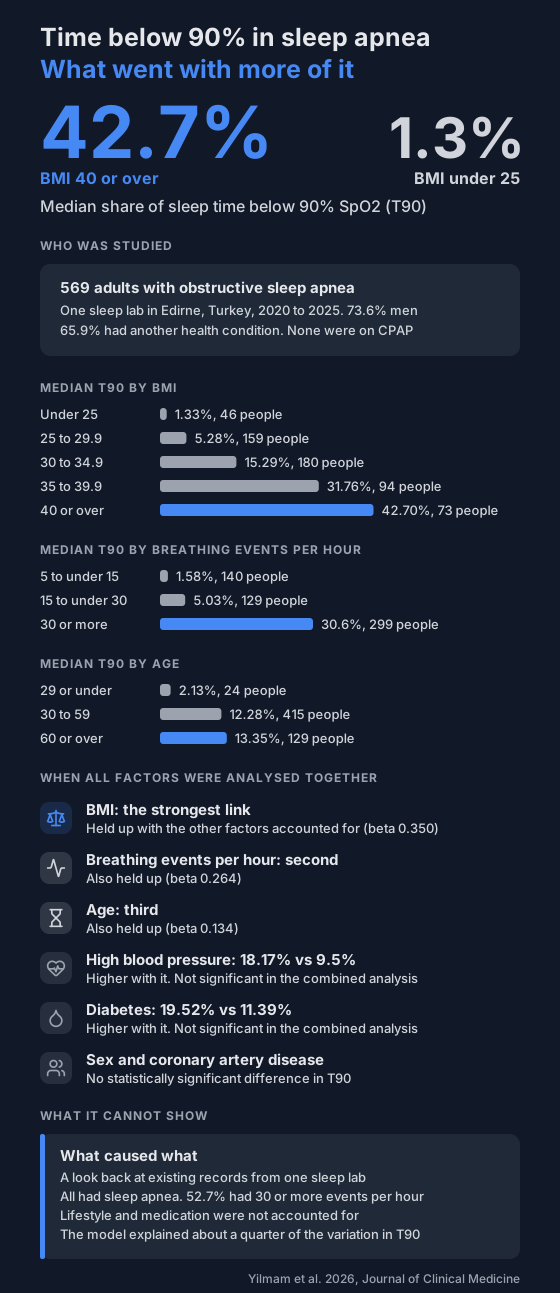
A 2026 study of 569 adults with sleep apnea looked at what went with more overnight time below 90% SpO2. BMI had the strongest link, then breathing events per hour, then age.
Sleep apnea is usually graded by how many breathing events you have per hour. That count doesn't say how long your oxygen stays low. T90, the share of the night spent below 90% SpO2, does.
A study published in January 2026 looked at which characteristics went with a higher T90 in people who already had sleep apnea.
Who was in the study?
- 569 adults with obstructive sleep apnea, found on an overnight sleep lab study.
- All were seen at one university sleep lab in Edirne, Turkey, between February 2020 and January 2025.
- 73.6% were men, and 73.1% were aged 30 to 59.
- 65.9% had at least one other health condition. High blood pressure was the most common (37.3%), then diabetes (21.6%) and coronary artery disease (9.1%).
- 52.7% had 30 or more breathing events per hour.
- People on CPAP, and people with central sleep apnea, heart failure, advanced COPD or interstitial lung disease, were left out.
The researchers took each person's T90 and average overnight SpO2 from the lab's records. T90 here is the percentage of sleep time below 90%.
What went with more time below 90%?
Body weight showed the widest gap. Median T90 by BMI:
- Under 25: 1.33%
- 25 to 29.9: 5.28%
- 30 to 34.9: 15.29%
- 35 to 39.9: 31.76%
- 40 or over: 42.70%
Average overnight SpO2 went the other way, from a median of 93.5% in the lowest BMI group to 88.5% in the highest.
Breathing events per hour:
- 5 to under 15: 1.58%
- 15 to under 30: 5.03%
- 30 or more: 30.6%
Age:
- 29 or under: 2.13%
- 30 to 59: 12.28%
- 60 or over: 13.35%
The youngest group differed from both older groups. It had only 24 people in it.
What about other health conditions?
Looked at one at a time, three went with a higher median T90:
- High blood pressure: 18.17% with it, 9.5% without.
- Diabetes: 19.52% with it, 11.39% without.
- Any other health condition: 15.57% with one, 8.84% without.
Two did not show a statistically significant difference:
- Coronary artery disease: 22.99% with it, 11.72% without. Only 52 people had it.
- Sex: 12.18% in men, 10.68% in women.
Which links held up together?
The researchers then put every factor into one analysis. Three stayed linked to a higher T90:
- BMI, the strongest (standardised coefficient 0.350).
- Breathing events per hour (0.264).
- Age (0.134).
High blood pressure, diabetes, coronary artery disease, having any other condition, and sex were not statistically significant in that analysis. The authors' reading is that the higher T90 seen with high blood pressure and diabetes was largely accounted for by BMI, age and the number of breathing events.
The same three factors were linked to a lower average overnight SpO2.
For more on weight and sleep apnea, see the obesity and sleep apnea study.
What doesn't it tell you?
- Cause. The study looked back at existing records. The authors say it can't show what caused what, or which came first.
- Everyone. One sleep lab, and everyone already had sleep apnea. Over half had 30 or more events per hour, so these T90 figures don't describe people without it.
- The whole picture. The combined analysis explained about a quarter of the variation in T90 (R² 0.259). Lifestyle, medication and how long people had their other conditions were not accounted for.
- Your own number. The T90 figures come from a sleep lab, where sleep time is measured. A home oximeter works out T90 over the whole recording, so the two aren't directly comparable.
What can you do with this?
If you track your overnight oxygen, T90 is worth watching alongside your dip count. The two measure different things, as sleep apnea beyond event counts explains.
A higher T90 than you expected is something to take to your doctor. Here's how to share your recordings.
Not a medical device. Does not diagnose, treat or prevent any condition. Discuss results and changes with a clinician.
References
- Yilmam I, Temelli S, Eker OH, Hatipoglu ON. Independent Risk Factors and Associated Comorbid Conditions Affecting Intermittent Hypoxia in 569 Patients Diagnosed with OSA. Journal of Clinical Medicine. 2026;15(2):627. doi:10.3390/jcm15020627