Two Kinds of Oxygen Burden in Sleep Apnea
A 2026 study of 2,136 adults found two groups with almost the same number of breathing events per hour, but one spent a median 5.4% of sleep below 90% oxygen and the other 63.6%.
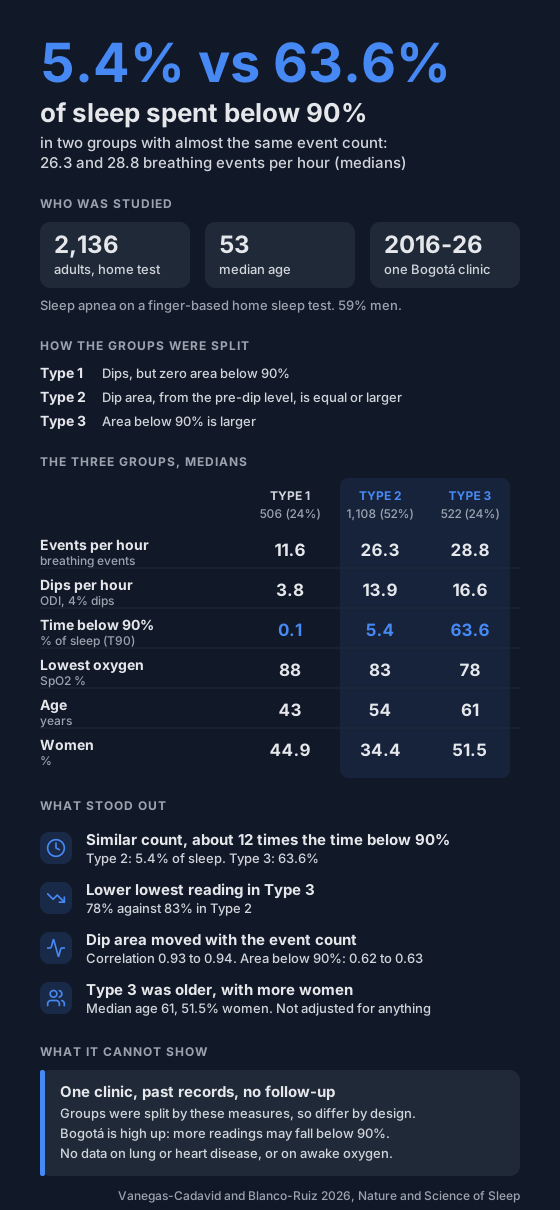
Sleep apnea is usually graded by one number: how many breathing events you have per hour. A 2026 study from Bogotá shows how much that number can leave out.
It found two groups of adults with almost the same event count. One group spent a median 5.4% of sleep below 90% oxygen. The other spent 63.6%.
Who was in the study?
- 2,136 adults who had a home sleep test at one clinic in Bogotá, Colombia, between 2016 and 2026.
- All had sleep apnea on that test, at 5 or more breathing events per hour.
- The test was a finger-based home device (WatchPAT) that also records oxygen.
- Median age was 53, and 59% were men.
- It's a look back at past records, not a trial.
What did it measure?
The device's software reports two areas of oxygen loss per hour of sleep:
- Dip area. How deep and how long each dip went below the level just before it. A dip from 97% to 93% counts, even though it never reaches 90%.
- Area below 90%. How far and how long oxygen sat below a fixed 90% line, whether or not a breathing event caused it.
Researchers often call both of these "hypoxic burden". The authors compared the two to sort people into three groups:
- Type 1: dips, but no area below 90% at all.
- Type 2: the dip area was equal to or larger than the area below 90%.
- Type 3: the area below 90% was larger.
What did the three groups look like?
Medians for each group:
- Type 1 (506 people, 24%): 11.6 events per hour, 0.1% of sleep below 90%, lowest oxygen 88%, age 43.
- Type 2 (1,108 people, 52%): 26.3 events per hour, 5.4% of sleep below 90%, lowest oxygen 83%, age 54.
- Type 3 (522 people, 24%): 28.8 events per hour, 63.6% of sleep below 90%, lowest oxygen 78%, age 61.
So Types 2 and 3 had event counts within 3 of each other. Type 3 spent about 12 times as much of the night below 90%. Their dips per hour (ODI) were also close, at 13.9 and 16.6.
Type 3 also had more women: 51.5%, against 34.4% in Type 2. The authors say that wasn't adjusted for anything and may come from age, body size, who gets referred, or health conditions the records didn't hold.
Why would the event count miss it?
The dip area rose closely with the event count, with a correlation of 0.93 to 0.94 in every group. That makes sense: more events means more dips.
The area below 90% followed the event count less closely, at 0.62 to 0.63 in Types 2 and 3. The authors suggest some of that time below 90% may be oxygen sitting low for long stretches, not dips from breathing events. They name things like breathing that stays too shallow overall, lung disease, heart failure, medication and altitude. The study couldn't check any of these.
What doesn't it tell you?
- Whether it matters for health. Nobody was followed up, so it doesn't show whether any group did better or worse later, or responded differently to therapy.
- Whether the groups hold up. The groups were split using these same two areas, so they differ on oxygen by design. The cut-off between Types 2 and 3 was simply where the two areas are equal. The authors call the groups exploratory, not clinical categories.
- Altitude. Bogotá sits high up, where oxygen readings fall below 90% more easily than at sea level. The split may look different elsewhere.
- Other conditions. The records didn't include lung disease, heart failure, smoking, oxygen use or awake oxygen levels.
- Other devices. The areas came from one maker's software, whose formulas aren't public.
- Everyone. It's past records from one clinic, of people referred for a sleep test.
What can you do with this?
An overnight oximeter doesn't count breathing events, and home oximetry is not a sleep study. But it does show the two sides this study pulled apart: how often your oxygen dipped, and how long it stayed low.
- ODI counts the dips.
- T90 is the share of the night below 90%.
- The lowest reading shows how deep it went.
Read them together, not one on its own. Here's how to read your report and how to share it with your doctor.
Not a medical device. Does not diagnose, treat or prevent any condition. Discuss results and changes with a clinician.
References
- Vanegas-Cadavid DI, Blanco-Ruiz AF. Beyond a Single Hypoxic Burden Value: Hypoxic Burden Ratio Assessed by Peripheral Arterial Tonometry in Obstructive Sleep Apnea. Nature and Science of Sleep. 2026;18:631688. doi:10.2147/NSS.S631688