Sleep Apnea Oxygen Profiles: An Italian Study
An Italian study sorted 1,386 adults with sleep apnea by their overnight oxygen measures and found three groups. Average time below 90% oxygen ran from 5.6% of the night to 51.5%.
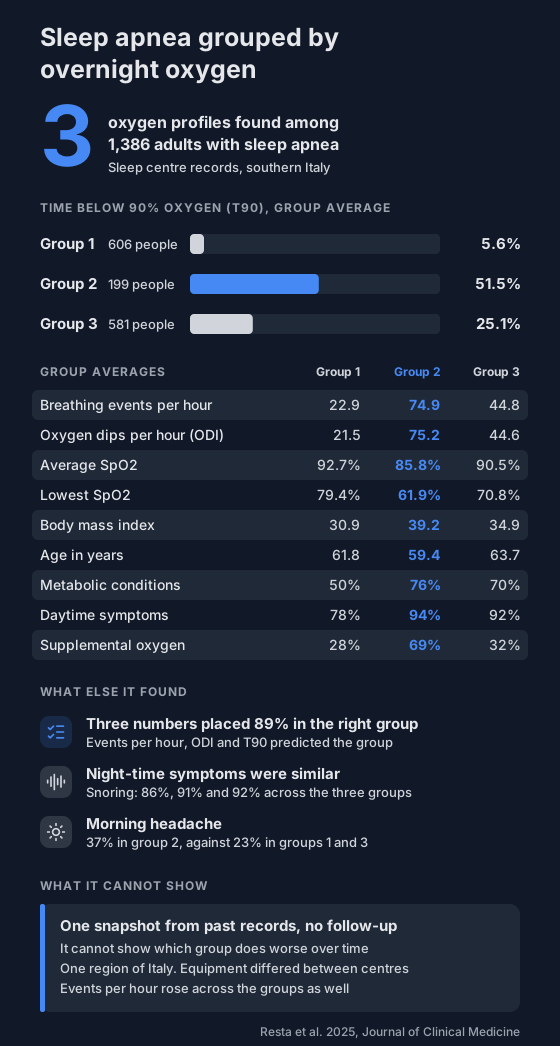
Sleep apnea is usually graded by one number: how many breathing events you have per hour of sleep. A study from southern Italy sorted people a different way, mostly by what their oxygen did overnight. It found three groups.
Who was studied?
- 1,386 adults who had been referred to a sleep centre and found to have obstructive sleep apnea.
- The centres belong to a network of 15 sleep labs in Apulia, southern Italy. This analysis used the labs whose records were ready.
- Average age was 62, and 71% were men.
- Each person had a full sleep study or a home sleep test.
- The researchers went back through existing medical records.
How were the groups made?
A clustering program looked for people whose sleep test numbers were alike. Nobody told it where to draw the lines. The researchers picked three groups from the result.
It used six numbers:
- Breathing events per hour.
- Oxygen dips per hour, the ODI.
- Share of the night below 90% oxygen, called T90.
- Average SpO2.
- Lowest SpO2.
- The average of the low points.
So five of the six were oxygen measures, and the event count was the sixth.
What did the three groups look like?
Group 1: the least oxygen loss (606 people)
- T90 averaged 5.6% of the night.
- Average SpO2 was 92.7%, and the lowest reading averaged 79.4%.
- 22.9 breathing events per hour.
- The lowest body mass index, at 30.9.
- 50% had a metabolic condition.
Group 2: the most oxygen loss (199 people)
- T90 averaged 51.5% of the night.
- Average SpO2 was 85.8%, and the lowest reading averaged 61.9%.
- 74.9 breathing events per hour.
- The highest body mass index, at 39.2, and the youngest group, at 59.4 years.
- 76% had a metabolic condition.
- They spent more of the night on their back: 59.8%, against 46.6% and 49.4%.
Group 3: in between (581 people)
- T90 averaged 25.1% of the night.
- Average SpO2 was 90.5%, and the lowest reading averaged 70.8%.
- 44.8 breathing events per hour.
- The oldest group, at 63.7 years, and 75% men.
- 70% had a metabolic condition.
Heart and blood vessel conditions were about as common in all three groups, at 71% to 74%.
Did the groups feel different?
At night, not much. Snoring was reported by 86%, 91% and 92%. Choking and night-time toilet trips were about as common in each group too.
During the day, yes.
- Daytime symptoms: 78% in group 1, against 94% in group 2 and 92% in group 3.
- Fatigue: 51%, against 67% and 65%.
- Morning headache: 37% in group 2, against 23% in the other two.
- The sleepiness score was highest in group 2, at 11.2 against 9.2 in both other groups.
What therapy were they on?
- Fixed-pressure CPAP was recorded for 39% of group 1, 69% of group 2 and 70% of group 3.
- Auto-adjusting machines were more common in group 1: 59%, against 45% and 34%.
- Fixed pressure settings were highest in group 2, at 10.9 against 8.8 in group 1.
- Supplemental oxygen was recorded for 69% of group 2, against 28% and 32%.
These describe what the clinics prescribed. The study didn't follow how anyone did on therapy.
How is this different from the usual grading?
Less than the headline suggests.
The event count rose across the groups in the same order as the oxygen measures: 22.9, 44.8 and 74.9 per hour. In each group the ODI was close to the event count.
The count says how often breathing was disturbed. T90 and lowest SpO2 say how long and how low oxygen went, which the count doesn't carry. The paper doesn't report how many people in each group fell into each of the usual events-per-hour bands, so it can't say how often the two ways of sorting disagree.
The researchers also tested whether three numbers could place someone in the right group: events per hour, ODI and T90. The best models got 88.9% of people right.
For more on this idea, see what the event count leaves out.
What can't it show?
- It's one snapshot from past records. Nobody was followed up, so it can't show which group does worse over time or responds differently to therapy. The authors say so.
- Past records can be incomplete or inaccurate, and the researchers couldn't fully check them.
- The centres used different equipment and scoring, which adds noise.
- Everyone came from one region of Italy.
- The authors conclude that oxygen loss tells the groups apart better than the event count alone. The study didn't test that head to head.
- Everyone already had sleep apnea found on a sleep test. The groups don't apply to people who haven't had one.
What can you do with it?
An overnight oximeter reports some of the same measures: ODI, T90, average and lowest SpO2. Home oximetry is not a sleep study, and you can't place yourself in one of these groups from it.
- Log T90 and lowest SpO2 alongside ODI, not just one of them. Here's how to read the report.
- If your T90 is regularly well above zero, share the recordings with your doctor.
Not a medical device. Does not diagnose, treat or prevent any condition. Discuss results and changes with a clinician.
References
- Resta E, Gnoni V, Cistulli P, Rosenzweig I, D'Ambrosio A, Peter P, Falcone VA, Quaranta VN, Sabato R, Toraldo MD, Laricchiuta A, Capozzolo A, Capozza E, Santomasi C, et al. Distinct Hypoxemic Profiles of Obstructive Sleep Apnea in Southern Italy: The Living with OSA and CPAP Study. Journal of Clinical Medicine. 2025;15(1):206. doi:10.3390/jcm15010206