Does ODI Track Breathing Events? A 2026 Study
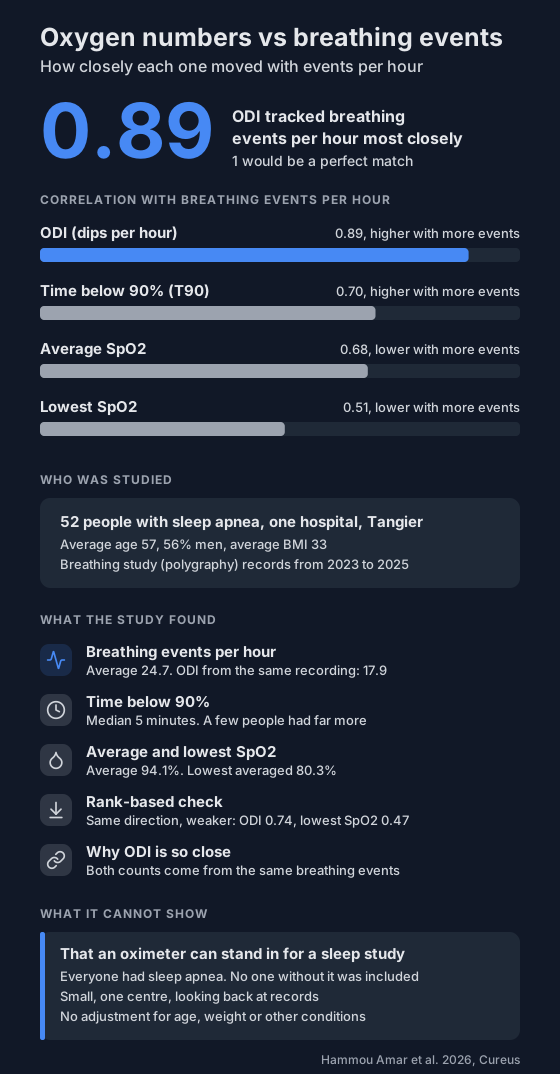
A 2026 study of 52 people with sleep apnea found the oxygen desaturation index moved closely with breathing events per hour (r = 0.89). Time below 90% and average SpO2 tracked less closely, and lowest SpO2 least.
An overnight oximeter gives you a handful of numbers: ODI, time below 90%, average SpO2 and your lowest reading. A sleep study gives a different one: how many breathing events you had per hour. So which oximeter number lines up best with that count?
A 2026 study from Morocco compared all four in the same people. ODI came out closest.
Who was in the study?
- 52 people with sleep apnea at one hospital in Tangier, Morocco.
- Records from 2023 to 2025, looked at after the fact.
- Average age 57 (range 16 to 91), 56% men, average BMI 33.
- 62% had heart or blood vessel conditions, mostly high blood pressure.
- Each had a breathing study called polygraphy, which records airflow, breathing effort and oxygen overnight. A lung specialist checked every recording by hand.
What did it find?
On average, people had 24.7 breathing events per hour. Their ODI, taken from the same recording, averaged 17.9.
Here's how closely each oxygen number moved with breathing events per hour, on a scale where 1 would be a perfect match:
- ODI: 0.89. More events, more dips.
- Time below 90%: 0.70. More events, more time below 90%.
- Average SpO2: 0.68. More events, lower average.
- Lowest SpO2: 0.51. More events, lower low point.
All four held up after a correction for testing several numbers at once.
The authors also ran a rank-based check, which leans less on a few extreme values. It pointed the same way but with weaker figures: 0.74 for ODI, 0.52 for time below 90%, 0.59 for average SpO2 and 0.47 for lowest SpO2.
Why is ODI so close?
Both numbers count the same thing from different angles. A breathing event often causes an oxygen dip, and a dip is what ODI counts. The authors say the close match partly reflects that overlap.
The two still aren't the same. How far oxygen drops during an event depends on how long it lasts, your starting level, your weight and your heart and lungs.
What about time below 90%?
It varied a lot between people. The median was 5 minutes, but the average was 52 minutes, pulled up by a few people with long stretches below 90%. The authors note that time below 90% can also come from weight, lung or heart problems, not only from breathing events.
What can't it show?
- That an oximeter can replace a sleep study. A strong correlation means the numbers rise and fall together, not that they match. Everyone here already had sleep apnea, so the study can't say how an oximeter sorts people with and without it.
- Cause. It looked back at records from one point in time.
- Other factors. It didn't adjust for age, weight, sex or other conditions, which the authors say could explain some of the links.
- Everyone. 52 patients from one hospital.
- Sleep time. Polygraphy doesn't measure sleep, so the hourly rates are per hour of recording.
Comparing a home oximeter with a sleep study in the same people gives a different picture. In this study, home ODI rose with breathing events but often came out much lower.
What can you do with this?
ODI is the oximeter number that moved most closely with breathing events here. Track it over several nights rather than reading one, and look at time below 90% next to it.
If your numbers worry you, or you snore and wake up tired, take your recordings to a doctor. The sleep apnea risk check can help you decide whether to.
Not a medical device. Does not diagnose, treat or prevent any condition. Discuss results and changes with a clinician.
References
- Hammou Amar S, Fdil SM, Zagaouch D, Bouti K, Hammi S. Association Between Nocturnal Oxygen Desaturation and the Severity of Obstructive Sleep Apnea: A Retrospective Study. Cureus. 2026;18(7):e112754. doi:10.7759/cureus.112754