Home Oximetry ODI vs a Lab Sleep Study
A 2024 study of 67 people compared home overnight oximetry with a lab sleep study. Home ODI tracked the sleep study, but 31% of those over the line in the lab had a home ODI under 5.
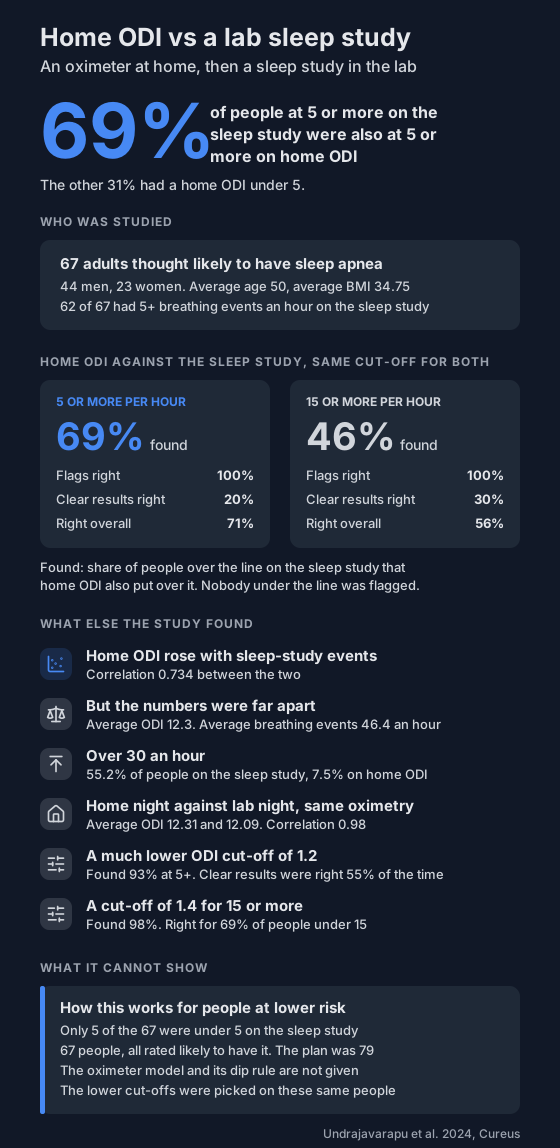
A home oximeter gives you an ODI: how many times an hour your oxygen dipped. A lab sleep study counts breathing events per hour instead. A 2024 study put both on the same 67 people to see how well they line up.
Short version: in this group, when home ODI was over the cut-off, the sleep study was too, every time. When home ODI was under the cut-off, the sleep study usually wasn't.
Who was studied?
- 67 adults at a hospital sleep lab, recruited from November 2018 to November 2020.
- All were rated likely to have sleep apnea, based on a sleepiness score and a risk checklist.
- 44 men and 23 women, average age 50, average BMI 34.75.
- People whose oxygen was already under 90% from long-term breathing failure were left out, and so were people who were acutely ill.
- Four of the five authors are based in India, and the ethics approval came from the Pondicherry Institute of Medical Sciences.
Each person wore an oximeter overnight at home. On a consecutive day they had a full sleep study in the lab, with the oximetry repeated alongside it.
On the sleep study, 62 of the 67 (92.5%) had 5 or more breathing events per hour. The average was 46.4 an hour.
Did home ODI track the sleep study?
Yes, as a trend. People with a higher home ODI tended to have more breathing events per hour in the lab (correlation 0.734).
The two numbers were far apart, though.
- Average home ODI: 12.3 an hour.
- Average breathing events on the sleep study: 46.4 an hour.
- Over 30 an hour: 55.2% of people on the sleep study, 7.5% on home ODI.
So a home ODI isn't the sleep-study number under another name. In this group it ran much lower.
How often did the two agree?
The authors used the same cut-off for both: 5 or more per hour.
- 69% of the people at 5 or more on the sleep study were also at 5 or more on home ODI. The other 31% had a home ODI under 5.
- Nobody under 5 on the sleep study had a home ODI of 5 or more.
- Of the people with a home ODI under 5, 20% were also under 5 on the sleep study.
- Overall, the two agreed for 71% of people.
At a cut-off of 15 or more per hour, the gap was wider.
- 46% of the people at 15 or more on the sleep study were also at 15 or more on home ODI.
- Again, nobody under the line on the sleep study was over it at home.
- Of the people with a home ODI under 15, 30% were also under 15 on the sleep study.
- Overall agreement was 56%.
The authors' reading: home oximetry can say who very likely has sleep apnea, and a low result should be read with caution.
What about a lower cut-off?
The authors looked for the ODI cut-off that fit their data best. It came out far lower than 5.
- For 5 or more events on the sleep study, the best-fitting ODI cut-off was 1.2. It picked up 93% of those people, with no false flags. Results under 1.2 were right 55% of the time.
- For 15 or more events, the best-fitting cut-off was 1.4. It picked up 98% of those people. It was right for 69% of the people under 15, so it flagged the other 31%.
The area under the curve, a score for how well home ODI separated the groups across all cut-offs where 1 is perfect, was 0.98 for 5 or more and 0.90 for 15 or more. The two cut-offs were chosen on these same 67 people, so they'd need testing on a new group.
Was a night at home different from a night in the lab?
Not by much, for the oximetry itself.
- Average ODI at home: 12.31.
- Average ODI in the lab: 12.09.
- Correlation between the two: 0.98, with no statistically significant difference (p=0.42).
The authors take that to mean one night of oximetry is enough. They cite an earlier study of 35 people that also found little night-to-night change in ODI. They also cite one that found ODI varied a lot from night to night in people taken off CPAP. More on that in how many nights to record.
What can't this study show?
- How it works for people at lower risk. Everyone was picked as a likely case, and only 5 of the 67 were under 5 on the sleep study. The figure for "clear results that were right" depends heavily on that mix.
- It was small. The plan was 79 people. The pandemic cut it to 67, and the authors name that as the main limitation.
- Which oximeter. The paper doesn't name the device or say how big a dip had to be to count. The authors recommend validating and calibrating the equipment.
- Your oximeter. A different device with a different dip rule can give a different ODI on the same night.
In a 2026 study of 475 people, a wrist oximeter's dip count averaged 2.4 an hour lower than the reference sleep test, and 9.5 an hour lower in the 37 people who had a lab sleep study: see how accurate is an oximeter-only home test.
What can you do with this?
- Home oximetry is not a sleep study. Read your ODI as a trend to track, not as the number a lab would give you.
- A low ODI doesn't settle the question. If you snore, wake up gasping or are sleepy in the day, tell your doctor whatever your recordings say.
- A high ODI on several nights is worth taking to your doctor. Here's how to share your recordings.
- For a quick look at your risk factors, try the sleep apnea risk check.
Not a medical device. Does not diagnose, treat or prevent any condition. Discuss results and changes with a clinician.
References
- Undrajavarapu A, Prasath A, Varghese M, George P, Kisku KH. Correlation Between Oxygen Desaturation Index Measured by Overnight Oximetry and Apnea-Hypopnea Index Measured by Polysomnography in Patients Diagnosed With Obstructive Sleep Apnea. Cureus. 2024;16(10):e71895. doi:10.7759/cureus.71895