Oxygen Burden: Why the Method Matters
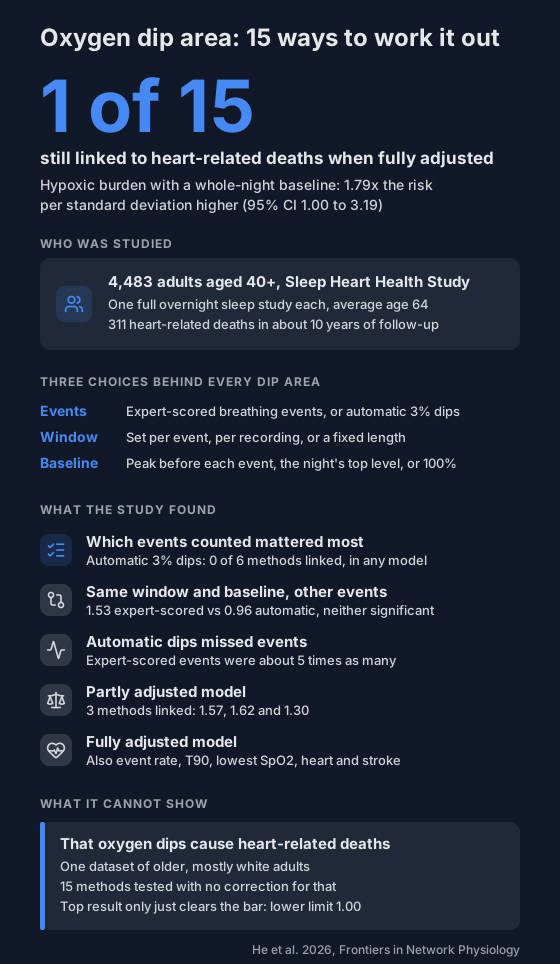
A 2026 study of 4,483 adults compared 15 ways to work out oxygen dip area. Only one was still linked to heart-related deaths after full adjustment, and which events were counted mattered most.
"Oxygen burden" or "hypoxic burden" is the area under your oxygen dips: how deep they go and how long they last, added up over the night. Earlier studies have linked it to heart-related deaths. But there's no single recipe for it.
A 2026 study worked out dip area 15 different ways from the same recordings. How it was worked out changed whether it lined up with heart-related deaths at all.
What is dip area?
Picture your SpO2 trace overnight. Each time it drops, the gap between a reference level and the trace forms a little valley. Dip area adds up those valleys.
A dip from 96% to 88% that lasts a minute counts for more than a quick drop to 93%. That's what ODI misses: it counts dips but not their size. For why that matters, see long breathing pauses and hypoxic burden.
Why are there so many versions?
Every method has to make three choices:
- Which events count. Breathing events scored by an expert from a full sleep study, or dips found automatically from the oxygen signal alone (here, drops of 3% or more).
- The window. How much time around each event to measure: just the event itself, a window set from the whole recording, or a fixed length based on the event.
- The baseline. The level the dip is measured down from: the highest reading in the 100 seconds before each event ends, the night's top level (99th percentile), or a flat 100%.
The study took three published methods and swapped these parts around, giving 15 versions. One of the three is hypoxic burden.
For the rules that decide what counts as a dip, see what counts as an oxygen dip.
Who was studied?
- 4,483 adults aged 40 and over from the Sleep Heart Health Study, a large US study.
- This was a new analysis of that existing data.
- Average age 64, 53% women, about 88% white.
- Each had one unattended overnight sleep study with full sleep study equipment, then about 10 years of follow-up.
- 311 died of heart-related causes in that time.
The researchers checked how strongly each version lined up with those deaths. They adjusted twice: first for age, sex, race, sleep time, smoking, alcohol and COPD, then also for breathing events per hour, T90, lowest SpO2, and existing heart disease and stroke.
What did it find?
- Automatic 3% dips: none of the 6 versions built on them was linked to heart-related deaths, in either model.
- Expert-scored breathing events, partly adjusted: 3 versions were linked, at 1.57, 1.62 and 1.30 times the risk for each standard deviation higher.
- Fully adjusted: only one was still linked. That was hypoxic burden with the night's top level as the baseline: 1.79 times the risk (95% CI 1.00 to 3.19).
- Same window and baseline, different events: 1.53 with expert-scored events against 0.96 with automatic dips, fully adjusted. Neither was statistically significant. The authors point to event choice as the main reason methods differed.
Why would the events matter so much? Expert-scored events outnumbered automatic 3% dips about five to one. Experts also count shallow breathing that ends in a brief awakening, even when oxygen drops less than 3%. An oxygen-only method can't see those.
What can't it show?
- Cause. It's an observational study. It shows links, not that dips cause heart deaths.
- Who it applies to. One dataset of middle-aged and older, mostly white adults. The authors say younger and more diverse groups need testing.
- A firm winner. The top result's lower limit is exactly 1.00, the edge of no link. 15 versions were tested without correcting for that, which the authors say was because it was exploratory.
- All automatic methods. Only one automatic dip method was tested, at a 3% threshold. The authors say other automatic methods still need checking.
- Other gaps. Airflow was measured with a less sensitive sensor, how long people had breathing problems was unknown, and little was known about past care.
The authors declared no funding for this analysis and no conflicts of interest.
There's also a small mismatch in the paper. The discussion calls the 1.53 result significant, but the fully adjusted table gives it p = 0.09, which the paper's own rule counts as a trend.
What does this mean for you?
If an app or report shows you an oxygen burden or dip area number, ask how it was worked out. Two numbers with the same name can come from different recipes and aren't comparable.
- Compare your own nights with the same app and settings, not against a figure from a study. The compare nights tool puts two side by side.
- A number built on automatic dips from a finger oximeter isn't the version this study linked to heart deaths.
- Look at the plain measures too: ODI, T90 and your lowest reading.
If your overnight oxygen worries you, take your recordings to a doctor. Here's how to share them.
Not a medical device. Does not diagnose, treat or prevent any condition. Discuss results and changes with a clinician.
References
- He S, Cistulli PA, de Chazal P. Comparison of oxygen desaturation area-based methods in predicting cardiovascular disease-related mortality outcomes. Frontiers in Network Physiology. 2026;6:1805587. doi:10.3389/fnetp.2026.1805587