Oxygen Signal Entropy and Sleep Apnea
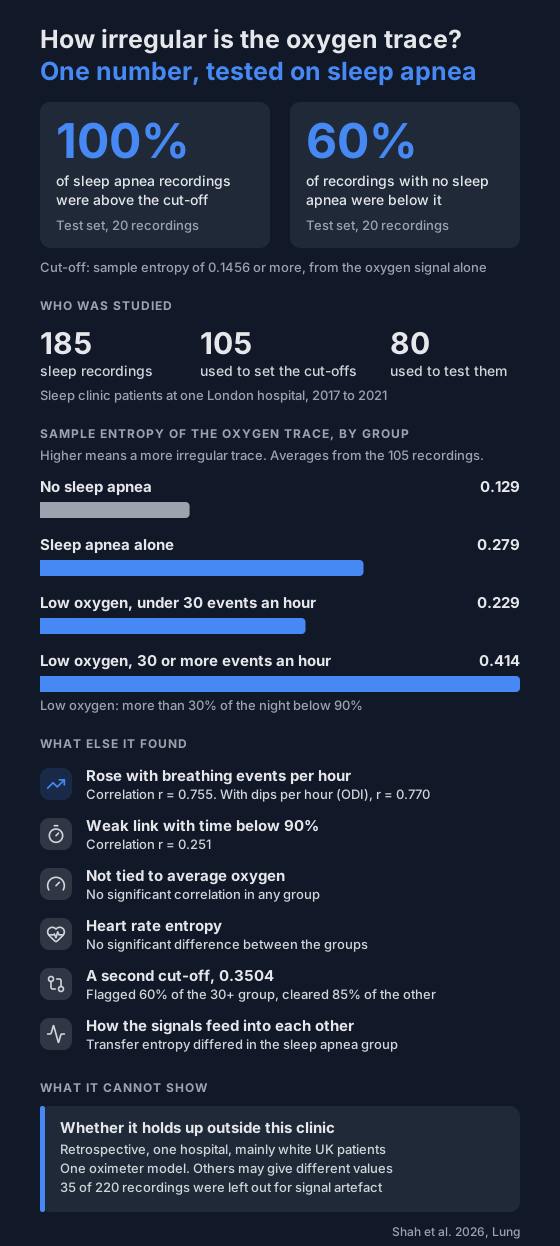
A 2026 study scored how irregular the overnight oxygen trace was. In the test recordings, one cut-off flagged every sleep apnea recording, and 40% of the recordings without it.
Overnight oximetry is usually boiled down to counts: how many dips per hour, how long below 90%. A study published in 2026 tried a different number, one that scores how irregular the whole oxygen trace is. It's called sample entropy.
What is sample entropy?
It's a score for how predictable a signal is.
- Take a short stretch of the oxygen trace.
- Look for other stretches of the night that match it.
- Check whether the next reading matches too.
If it usually does, the trace repeats itself and the score is low. If it often doesn't, the trace is irregular and the score is high. The number has no units.
A flat, steady night scores low. A night where oxygen keeps dropping and recovering scores higher.
Who was studied?
- Patients at a London sleep clinic who had an overnight sleep study between 2017 and 2021.
- The recordings were sorted into four groups by the sleep study result:
- no sleep apnea
- sleep apnea alone, meaning 5 or more breathing events per hour without the low oxygen below
- low oxygen with 30 or more events per hour
- low oxygen with fewer than 30 events per hour
- "Low oxygen" meant more than 30% of the night below 90%.
- 105 recordings were used to set the cut-offs, and 80 different recordings to test them.
- Another 35 recordings were left out because 10% or more of the signal was artefact.
The researchers worked with the recordings after the fact. Nobody was tested live.
Was the oxygen trace more irregular with sleep apnea?
Yes. Average sample entropy of the oxygen signal in the first 105 recordings:
- No sleep apnea: 0.129
- Sleep apnea alone: 0.279
- Low oxygen, under 30 events per hour: 0.229
- Low oxygen, 30 or more events per hour: 0.414
All three groups differed significantly from the no sleep apnea group.
The score also rose with the event counts:
- With breathing events per hour, the correlation was 0.755.
- With oxygen dips per hour (ODI), it was 0.770.
- With time below 90%, it was weak, at 0.251.
- With average overnight oxygen, there was no significant correlation in any group.
The authors' explanation is simple: more breathing events mean more drops and recoveries, so the trace is less regular.
Could one number separate the recordings?
The team picked a cut-off of 0.1456, chosen so that no sleep apnea recording in the first set fell below it. Then they tried it on the test recordings from the sleep apnea alone group and the no sleep apnea group.
- All of the sleep apnea recordings were above the cut-off.
- 60% of the recordings with no sleep apnea were below it.
- So 40% of the recordings with no sleep apnea were above the line too.
Each of those two test groups had 20 recordings.
A second, higher cut-off of 0.3504 was used to split the two low oxygen groups. In the test set it flagged 60% of the group with 30 or more events per hour and cleared 85% of the group with fewer.
What about the low oxygen group with few events?
This group spent a large part of the night below 90% but had fewer breathing events. Its oxygen trace was more regular than in the low oxygen group with many events, 0.229 against 0.414. The authors read the more regular signal as a sign of a sicker group that may need different care. The study did not test that.
Did they look at other signals?
- Heart rate. Its sample entropy did not differ significantly between the groups.
- Transfer entropy. This measures how much one signal tells you about another a few seconds later. With sleep apnea, more information passed from heart rate, breathing rate and nasal airflow to the oxygen signal, and less from oxygen to breathing rate.
What can't this study show?
- It was a proof-of-concept study at one hospital, using recordings that already existed.
- The patients were mainly white and from the UK. Skin tone can affect oximeter readings, so the authors say it needs testing in a more diverse group.
- Every recording used the same oximeter model. A different oximeter may give different entropy values, so the cut-offs may not carry over.
- The test group with no sleep apnea was younger than the one used to set the cut-off, 38 against 57 on average.
- Not everyone had a blood gas test, so the authors could not draw conclusions about obesity hypoventilation syndrome.
- The oxygen signal came from a multi-channel sleep study, not from an oximeter worn on its own.
- One author reported grants and fees from drug companies that make COPD medicines. The other authors declared no conflicts of interest.
The authors call for larger, forward-looking studies.
What does this mean for your own recordings?
- Your oximeter report won't show sample entropy. It isn't a standard report number.
- The closest thing you already have is ODI, which rose and fell with sample entropy in this study.
- If you want to see how irregular a night was, look at the trace itself in the session viewer.
- Home oximetry is not a sleep study. If your nights show a lot of dips, share the recordings with your doctor.
For other ways researchers are scoring the oxygen trace, see new oxygen dip measures vs ODI and AI reading overnight oximetry.
Not a medical device. Does not diagnose, treat or prevent any condition. Discuss results and changes with a clinician.
References
- Shah AJ, Alotaibi N, Cheung M, Nixon R, Gosal E, Saigal A, Hurst JR, Mani AR, Mandal S. Oxygen Saturation Sample Entropy, a Novel Diagnostic Tool in Sleep Disordered Breathing. Lung. 2026;204(1):5. doi:10.1007/s00408-025-00864-w