Sleep Apnea Phenotypes: Weight vs Sleepiness
A 2026 study sorted 2,516 adults with sleep apnea into three groups. The most breathing events showed up both in the heaviest, less sleepy group and in a lighter, very sleepy group.
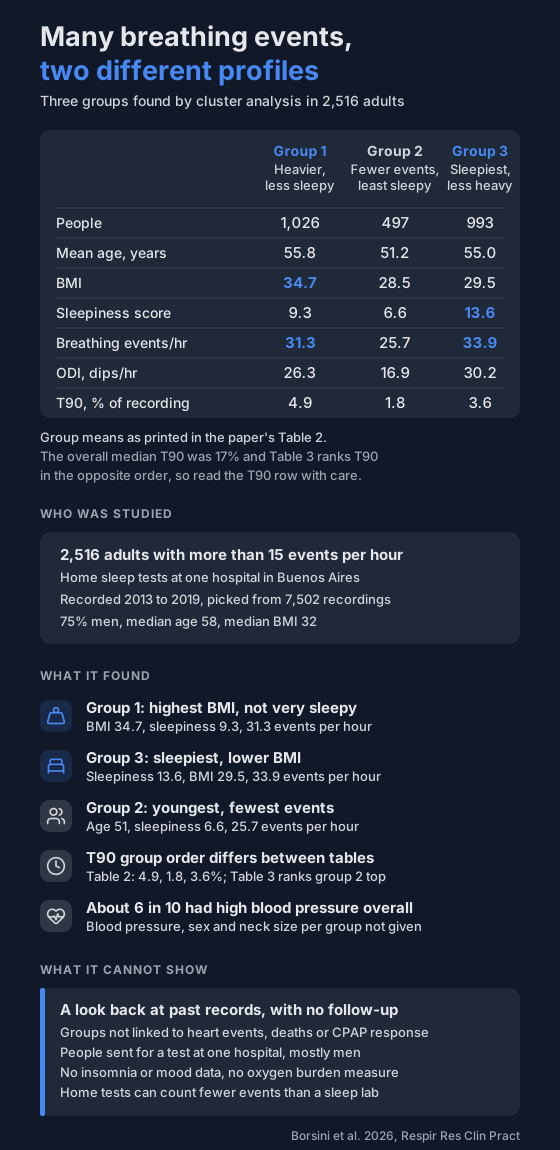
The usual picture of sleep apnea is someone heavy who's sleepy all day. A 2026 study from Argentina found that picture splits in two.
It sorted 2,516 adults with sleep apnea into three groups using measures such as age, weight, sleepiness and time below 90% oxygen (T90). The two groups with the most breathing events per hour looked quite different: one was heavier but not very sleepy, the other lighter but very sleepy.
Who was studied?
- 2,516 adults who had a home sleep test at a hospital in Buenos Aires between 2013 and 2019.
- They were picked from 7,502 recordings because they had more than 15 breathing events per hour.
- 75% were men.
- Median age was 58 and median BMI was 32.
- About 6 in 10 had high blood pressure.
- Nobody was using CPAP or oxygen at the time of the test.
The home test measured airflow, breathing effort and blood oxygen. Sleepiness was scored with the Epworth Sleepiness Scale, where higher means sleepier and above 10 counts as very sleepy.
What were the three groups?
A computer method called k-means clustering grouped people who had similar numbers. No one set the group rules in advance.
These are the group averages as printed in the paper's Table 2:
- Group 1 (1,026 people): BMI 34.7, sleepiness score 9.3, 31.3 breathing events per hour, 26.3 oxygen dips per hour, T90 4.9%.
- Group 2 (497 people): BMI 28.5, sleepiness score 6.6, 25.7 breathing events per hour, 16.9 oxygen dips per hour, T90 1.8%.
- Group 3 (993 people): BMI 29.5, sleepiness score 13.6, 33.9 breathing events per hour, 30.2 oxygen dips per hour, T90 3.6%.
Group 2 was also the youngest, with an average age of 51. Groups 1 and 3 averaged about 55.
What stands out?
- High event counts came with two different profiles. Group 1 was the heaviest but only slightly sleepy. Group 3 had a lower BMI but was the sleepiest and had the most events.
- The heaviest weren't the sleepiest. The authors say relying on a sleepiness score could miss people like group 1.
For more on people with many events who don't feel sleepy, see sleep apnea without sleepiness.
Can you trust the T90 numbers?
Read them with care.
- Table 2 gives group T90 averages of 4.9% for group 1, 1.8% for group 2 and 3.6% for group 3.
- Table 1 gives a median T90 of 17% for the whole group, and 87% spent more than 3% of the recording below 90%.
- Group averages all under 5% don't fit with that.
- Table 3 ranks T90 the other way round: low for group 1, high for group 2, in between for group 3.
- The paper's text sides with Table 2, calling group 2 the one with the least low oxygen.
The paper doesn't explain the gap. So neither the T90 figures nor the order between groups can be relied on.
An Italian study that grouped people by oxygen measures alone found a much wider spread: see sleep apnea oxygen profiles. New to T90? Read what T90 means.
What doesn't it tell you?
- What happens next. It's a look back at past records. The groups weren't linked to heart problems, deaths or how people did on CPAP.
- Everyone. These were people sent for a test at one hospital, and three in four were men.
- The full picture. There was no data on insomnia, mood or most other health conditions, and no oxygen burden measure.
- Exact event counts. The authors note home tests tend to count fewer events than a sleep lab.
- Which inputs mattered. The paper lists two slightly different sets of variables used for the grouping.
What can you do with this?
Not feeling sleepy doesn't mean your night is quiet. If you snore loudly, someone has seen you stop breathing, or you wake up tired, talk to a doctor.
The sleep apnea risk check takes about a minute and helps you decide whether to.
An overnight oximeter can't tell you whether you have sleep apnea. It logs your T90, oxygen dips and pulse, so you can share them with your doctor.
Not a medical device. Does not diagnose, treat or prevent any condition. Discuss results and changes with a clinician.
References
- Borsini E, Leiva Agüero S, Blanco M. Clinical phenotypes of obstructive sleep apnea identified using cluster analysis. Respiratory Research & Clinical Practice. 2026;52(4):e20250497. doi:10.36416/1806-3756/e20250497