Sleep Apnea Symptoms and Overnight Oxygen
A 2026 study of 789 people with sleep apnea grouped them by sleepiness and sleep quality. Mood and fatigue scores differed between the groups, while time below 90% and mean SpO2 showed no significant link after adjustment.
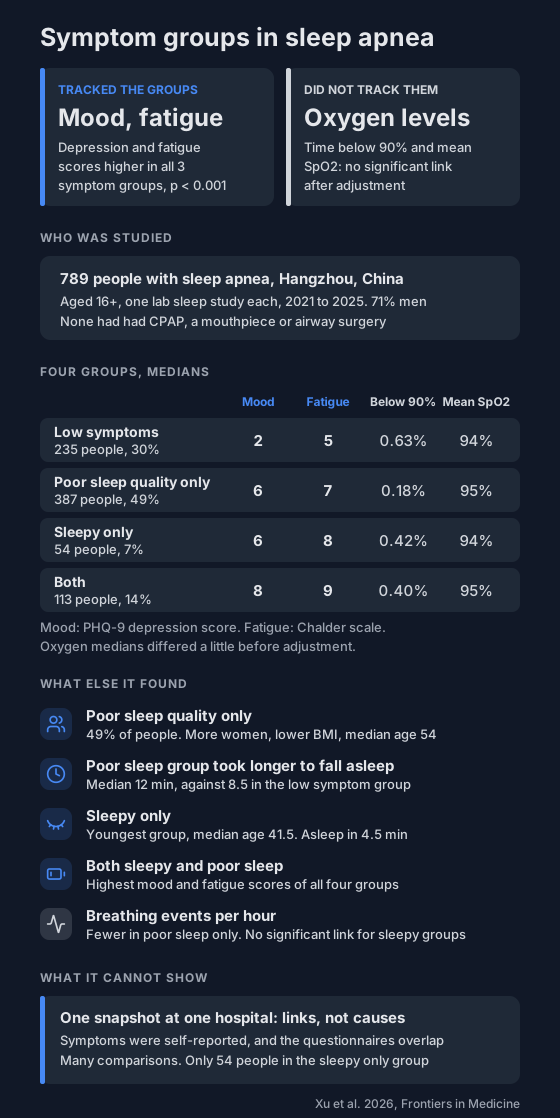
Sleep apnea doesn't feel the same for everyone. Some people are sleepy all day, some sleep badly, some have both, and some notice little. A 2026 study from China asked what else differs between those groups, including the oxygen numbers your oximeter records.
Mood and fatigue scores lined up with the groups. Time below 90% and average SpO2 didn't, once age, sex and BMI were taken into account.
Who was studied?
- 789 people aged 16 and over with sleep apnea at one hospital sleep centre in Hangzhou, China, tested between 2021 and 2025.
- The authors looked back at hospital records, so this is a retrospective study.
- 71% were men.
- Everyone had at least 5 breathing events per hour on one night of a full lab sleep study.
- None had had CPAP, a mouthpiece or airway surgery.
- Before the study night, everyone was asked to fill in questionnaires on sleep quality (the Pittsburgh Sleep Quality Index), sleepiness (the Epworth scale), depression (PHQ-9), anxiety (GAD-7) and fatigue (the Chalder scale).
How were the groups made?
The authors used two cut-offs, one for sleep quality and one for sleepiness:
- Low symptoms: neither. 235 people (30%).
- Poor sleep quality only: 387 people (49%).
- Sleepy only: 54 people (7%).
- Both: 113 people (14%).
Poor sleep quality here is a questionnaire result, not a confirmed case of insomnia.
What lined up with the groups?
Mood and fatigue, most clearly. Median scores went from lowest in the low symptom group to highest in the group with both:
- Depression score: 2, 6, 6 and 8 (low, poor sleep only, sleepy only, both).
- Fatigue score: 5, 7, 8 and 9.
- Anxiety score: 2, 4, 3 and 6.
After adjusting for age, sex and BMI, higher depression and fatigue scores went with all three symptom groups (p < 0.001). The link was strongest for the group with both. Anxiety scores had a clear link to the two poor sleep groups, and a weaker one to the sleepy only group (p = 0.047).
Who was in each group also differed:
- Poor sleep quality only: more women, lower BMI, median age 54. They took longer to fall asleep in the lab (median 12 minutes, against 8.5) and slept less.
- Sleepy only: the youngest group (median age 41.5) with the highest BMI, though the BMI link wasn't significant after adjustment. They fell asleep fastest, in a median of 4.5 minutes, and had more REM sleep.
- Both: more REM sleep than the low symptom group, and more leg movements in sleep, though the authors call the leg movement link tentative.
What about oxygen?
Before adjustment, the groups' oxygen numbers differed a little. The poor sleep quality only group had the least time below 90% (median 0.18% of sleep time, against 0.63% in the low symptom group) and fewer breathing events per hour.
After adjusting for age, sex and BMI:
- Time below 90%, average SpO2 and the average depth of oxygen dips had no statistically significant link to any group.
- The same held in people with 15 or more breathing events per hour.
- Fewer breathing events per hour and fewer oxygen dips per hour (ODI) went with the poor sleep quality only group, and a higher lowest SpO2 did too.
- Those two oxygen links faded once breathing events per hour were also adjusted for.
- That extra adjustment turned up one weak new link: shallower average dips in the sleepy only group (p = 0.026).
- Breathing events per hour had no significant link to the two sleepy groups.
The authors say this doesn't mean low oxygen has nothing to do with symptoms. Summary numbers like time below 90% may miss things, and they suggest measures that combine the depth and length of dips, like oxygen burden, should be studied next.
What can't it show?
- Cause. Everything was measured at one point in time, so it shows what went together, not what caused what.
- Overlap. All the symptoms were self-reported, and the questionnaires share ground. The depression one asks about sleep and energy, for example.
- Chance. Many measures were compared without correcting for it, and the authors call many of the smaller links hypothesis-generating.
- Small group. Only 54 people were sleepy only, so those results are less certain.
- Who it applies to. One hospital sleep centre in China. 399 of 1,230 eligible people were left out because their sleep questionnaires were missing.
What can you do with this?
Your oximeter shows what your oxygen did overnight. In this study, once age, sex and BMI were allowed for, time below 90% and average SpO2 didn't line up with whether people were sleepy or sleeping badly. Median average SpO2 was 94% or 95% in every group, while mood and fatigue scores differed widely.
So when you talk to your doctor, bring both:
- How you're sleeping, how sleepy you are in the day, and your mood.
- Your recordings. Here's how to share them.
The authors suggest people whose main complaint is poor sleep are also assessed for insomnia. If insomnia is confirmed, they say CBT-I may be considered alongside sleep apnea care.
For more on symptoms and sleep apnea:
- Sleepiness subtypes and mood
- Sleep apnea without sleepiness
- Sleep apnea phenotypes: weight vs sleepiness
Not sure whether to bring up sleep apnea? The sleep apnea risk check takes about a minute.
Not a medical device. Does not diagnose, treat or prevent any condition. Discuss results and changes with a clinician.
References
- Xu J, Tian Y, Luo W, Zhai Z, Wang X, Wang T, Xu Q, Hu X, Zhang L. Clinical, polysomnographic, and psychological profiles across questionnaire-defined symptom groups in obstructive sleep apnea. Frontiers in Medicine. 2026;13:1948049. doi:10.3389/fmed.2026.1948049