Is SpO2 Higher on a Second Altitude Trip?
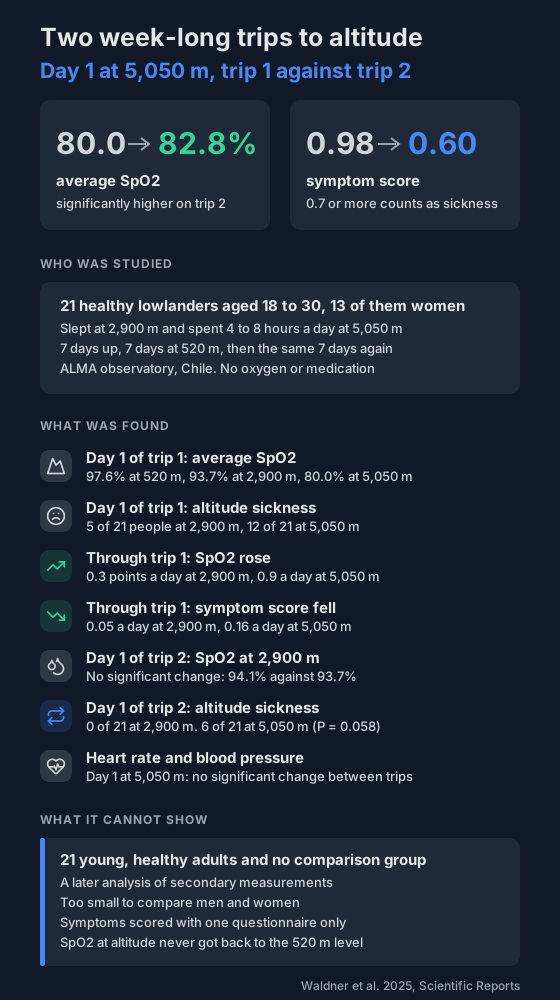
A 2025 study sent 21 healthy lowlanders on two week-long stays at 2,900 m and 5,050 m, a week apart. On day 1 of the second trip SpO2 was higher at 5,050 m but not at 2,900 m, and symptom scores were lower at both.
Your SpO2 drops when you go up a mountain, then creeps back up over the following days. But what happens if you come down for a week and go back up?
A study published in 2025 tested that on 21 people, using the shift pattern of a high-altitude observatory in Chile. The authors describe it as a prospective cohort study: one group, measured repeatedly.
Who was in the study?
- 21 healthy adults aged 18 to 30, recruited in Calgary and Zurich. 13 were women.
- None had slept above 1,500 m in the 4 weeks before.
- They started in Santiago de Chile at 520 m, where baseline readings were taken.
- Then they slept at 2,900 m and drove up to 5,050 m each day, staying 4 to 8 hours.
- After 7 days they went back to 520 m for 7 days, then did the same 7 days again.
- No alcohol or medication was allowed. Oxygen was kept for long stays at 5,050 m or bad symptoms.
Resting SpO2 was taken with a finger pulse oximeter. Symptoms were scored with a questionnaire covering headache, dizziness, weakness, nausea and similar. A score of 0.7 or more counted as acute mountain sickness.
What happened on the first day up?
Average SpO2 on trip 1:
- 520 m: 97.6%
- 2,900 m: 93.7%
- 5,050 m: 80.0%
The average symptom score went from 0.05 at 520 m to 0.44 at 2,900 m and 0.98 at 5,050 m. 5 of the 21 people (23.8%) met the cut-off for acute mountain sickness at 2,900 m. At 5,050 m it was 12 of 21 (57.1%).
Resting heart rate went from 65 beats a minute at 520 m to 81 at 2,900 m and 98 at 5,050 m.
These figures are from the paper's results text and Table 2. Its abstract prints some of them 0.1 lower, and gives 6 hours a day at 5,050 m where the methods say 4 to 8.
For the basics of why this happens, see blood oxygen at altitude.
Did SpO2 climb back during the week?
Yes, at both heights, and faster at the higher one.
- At 2,900 m, SpO2 rose by about 0.3 points a day.
- At 5,050 m, it rose by about 0.9 points a day.
- The symptom score fell by 0.05 a day at 2,900 m and 0.16 a day at 5,050 m.
SpO2 never got back to the 520 m level. The authors' explanation for the faster rise at 5,050 m is that breathing is driven harder once SpO2 is below about 90%, and at 2,900 m it stayed above that. The paper reports no breathing measurements and says no blood tests were done, so that's a suggestion, not a result.
What changed on the second trip?
Day 1 of trip 2, compared with day 1 of trip 1:
- SpO2 at 2,900 m: 94.1% against 93.7%, no significant change.
- SpO2 at 5,050 m: 82.8% against 80.0%, a significant rise.
- Symptom score at 2,900 m: 0.06 against 0.44, significantly lower.
- Symptom score at 5,050 m: 0.60 against 0.98, significantly lower.
- Acute mountain sickness at 2,900 m: nobody, against 5 of 21, a significant drop.
- Acute mountain sickness at 5,050 m: 6 of 21 (28.6%), against 12 of 21. That gap was just short of statistical significance (P = 0.058).
So symptoms at 2,900 m started lower even though SpO2 there was about the same.
During the second week, SpO2 kept rising: 0.3 points a day at 2,900 m and 0.5 a day at 5,050 m. The symptom score kept falling at 5,050 m, by 0.08 a day, and stayed flat at 2,900 m.
The first trip didn't stop altitude sickness on the second. 6 people still met the cut-off on day 1 at 5,050 m.
What about heart rate and blood pressure?
- On day 1 at 5,050 m, heart rate and blood pressure were not significantly different between the two trips.
- During trip 1, heart rate fell by about 5 beats a minute per day at 5,050 m and 2 per day at 2,900 m, but stayed above the 520 m level.
- During trip 2, it fell by about 2 beats a minute per day at 5,050 m, with no significant change at 2,900 m.
- Before trip 2, resting heart rate and blood pressure at 520 m were lower than before trip 1.
- Changes in blood pressure between the trips were inconsistent.
The paper's conclusion is that SpO2 and symptoms got better with time and repetition, and heart rate and blood pressure didn't follow. That sits oddly with its own results, which show heart rate falling day by day at altitude. The paper is also inconsistent on heart rate at 2,900 m: the discussion says it was lower on arrival for trip 2, but Table 2 marks no significant change on day 1 and the results text reports lower values on days 2 and 3.
What can't it tell you?
The authors list three limitations:
- Planned result. This was a post hoc analysis of secondary measurements from a larger trial.
- Sex differences. The group was too small to compare men and women.
- Symptoms. One questionnaire was used. Lake Louise scores weren't collected.
Three more that we'd add, which the authors don't list:
- Cause. There was no comparison group that skipped the first trip.
- Everyone. 21 healthy people aged 18 to 30. Older adults and people with health conditions weren't included.
- Other gaps. It tested a 7-day break only. Readings were daytime spot checks at rest.
What can you do with this?
- In this study SpO2 read lower at altitude and rose a little each day. Your own numbers may differ.
- A lower symptom score on the second trip didn't always come with a higher SpO2, so an oximeter reading alone doesn't tell you how you'll feel.
- If you're logging readings on a trip, take them at rest and at the same time each day, and compare like with like.
One general safety point that isn't from the study: if you feel unwell at altitude, tell someone and get medical help, whatever the oximeter says.
Related reading:
- How common is altitude sickness?
- Pre-acclimatising for altitude
- Sleep of high-altitude workers
- Oxygen dips in the first nights at altitude
Not a medical device. Does not diagnose, treat or prevent any condition. Discuss results and changes with a clinician.
References
- Waldner NF, Hartmann SE, Muralt L, Lichtblau M, Bader PR, Rawling JM, Lopez I, Ulrich S, Poulin MJ, Bloch KE, Furian M. Oxygen saturation and acute mountain sickness during repeated altitude exposures simulating high-altitude working schedules. Scientific Reports. 2025;15(1):12987. doi:10.1038/s41598-025-97554-7