Hypoxic Burden and Breathing Muscle Strength
A 2026 study of 137 adults in Pakistan found that a bigger overnight oxygen shortfall went with higher inflammation markers and weaker breathing muscles.
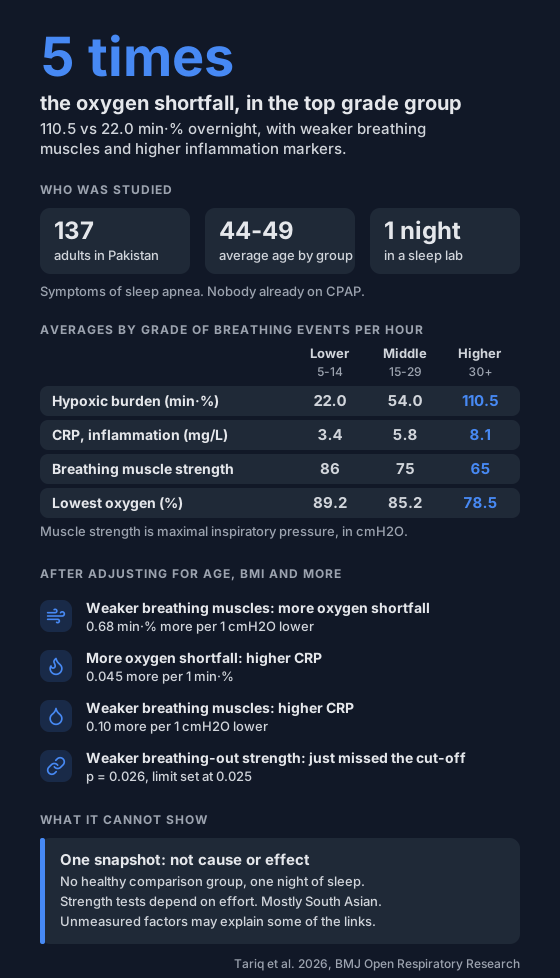
Sleep apnea is usually graded by how many breathing events you have per hour. A 2026 study from Pakistan looked at a different number: hypoxic burden. It asked whether a bigger overnight oxygen shortfall goes with more inflammation and weaker breathing muscles.
What is hypoxic burden?
Picture your overnight oxygen trace. Every time it dips, the dip has a depth and a length. Hypoxic burden is the total area under all those dips, added up across the night. The authors scaled it to total sleep time and gave it in min·%. They don't say whether that is per hour, so don't compare these numbers with other studies' hypoxic burden figures.
A few short dips and one long deep dip can add up to the same area. That's why it can say more than a count of dips. For more on it, see two kinds of oxygen burden and hypoxic burden and new high blood pressure.
Who was studied?
- 137 adults with symptoms such as snoring, witnessed breathing pauses or daytime sleepiness.
- Recruited one after another at five hospitals with sleep services in Lahore, Pakistan.
- 81 of the 137 were men.
- Average age 44.0 to 49.2 across the three groups.
- Nobody already known to have sleep apnea or on CPAP.
- People with lung disease, nerve or muscle disease, inflammatory conditions or recent infection were left out.
Each person had one night in a sleep lab. The next morning they gave a fasting blood sample for inflammation markers. They also had a breathing muscle strength test. The strength test measures how hard you can breathe in (maximal inspiratory pressure) and out (maximal expiratory pressure) against a gauge.
The authors grouped people by breathing events per hour: 45 people at 5 to 14, 46 at 15 to 29, and 46 at 30 or more.
What did it find?
Across the three groups, from fewer to more breathing events per hour, the averages were:
| Lower | Middle | Higher | |
|---|---|---|---|
| Hypoxic burden (min·%) | 22.0 | 54.0 | 110.5 |
| CRP (mg/L) | 3.4 | 5.8 | 8.1 |
| IL-6 (pg/mL) | 2.6 | 4.3 | 6.2 |
| TNF-alpha (pg/mL) | 3.2 | 5.0 | 6.8 |
| Breathing-in strength (cmH2O) | 86 | 75 | 65 |
| Breathing-out strength (cmH2O) | 102 | 91 | 78 |
| Lowest oxygen (%) | 89.2 | 85.2 | 78.5 |
CRP, IL-6 and TNF-alpha are blood markers of inflammation. Hypoxic burden differed between every pair of groups, and had the largest effect size of the sleep-lab measures. Two blood cell ratios used as inflammation markers also rose across the groups.
What held up after adjusting?
The authors used regression models that account for several other factors at once. They set the cut-off for the two main models at p below 0.025.
For hypoxic burden, these stayed linked:
- Higher BMI: 1.35 more min·% per BMI point.
- Older age: 0.25 more per year.
- A higher sleepiness score: 0.50 more per point.
- Weaker breathing-in strength: 0.68 more per 1 cmH2O lower.
Breathing-out strength was linked too, but just missed the cut-off (p = 0.026). Activity level, diet quality, income and education group and medication use were not. The whole model explained 47% of the differences in hypoxic burden between people.
For CRP, these stayed linked (the paper doesn't give the CRP unit for these figures):
- More hypoxic burden: 0.045 higher per 1 min·%.
- Weaker breathing-in strength: 0.10 higher per 1 cmH2O lower.
- Higher BMI: 0.28 higher per BMI point.
- Older age: 0.07 higher per year.
Age is in the results text but left out of the CRP findings in the abstract and discussion. The CRP model explained 58% of the differences in CRP.
What can't it show?
- It's a cross-section. Everyone was measured once, so it can't say which came first. The authors say inflammation may weaken the breathing muscles, or weak muscles may be a sign of a heavier overall load. This study can't tell the two apart.
- There was no healthy comparison group, so it can't say whether these differences are specific to sleep apnea or come from weight and other health factors.
- It was one night in the lab, and the authors note first-night effects and night-to-night variation.
- The strength tests need the person's best effort, and they don't measure the diaphragm directly.
- Everyone came from tertiary care centres in Lahore, a mostly South Asian group, so it may not apply elsewhere.
- Lifestyle details were self-reported, and unmeasured factors could explain some of the links.
- The grouping used breathing events per hour, so the rise in that number across groups is built in.
The authors declared no competing interests and no specific funding.
What can you do with this?
Hypoxic burden is calculated from a full sleep study, and home oximetry is not a sleep study. But the pieces it's built from are on your own trace: how deep the dips go and how long they last.
- ODI counts the dips.
- T90 is the share of the night below 90%.
- The session viewer shows each dip on a timeline.
If you snore, wake up unrefreshed or someone has seen you stop breathing, try the sleep apnea risk check. Then share your oximeter data with your doctor.
Not a medical device. Does not diagnose, treat or prevent any condition. Discuss results and changes with a clinician.
References
- Tariq A, Saad A, Zadeh SAM. Hypoxic burden, systemic inflammation and respiratory muscle dysfunction in obstructive sleep apnoea: a multicentre cross-sectional study. BMJ Open Respiratory Research. 2026;13(1):e004397. doi:10.1136/bmjresp-2026-004397