Breathing Stability Index: A 2026 Study
A 2026 study of 43,611 overnight sleep records tested a new measure of how steady breathing effort is. A score built from it was linked to death in two Boston groups, not in older men.
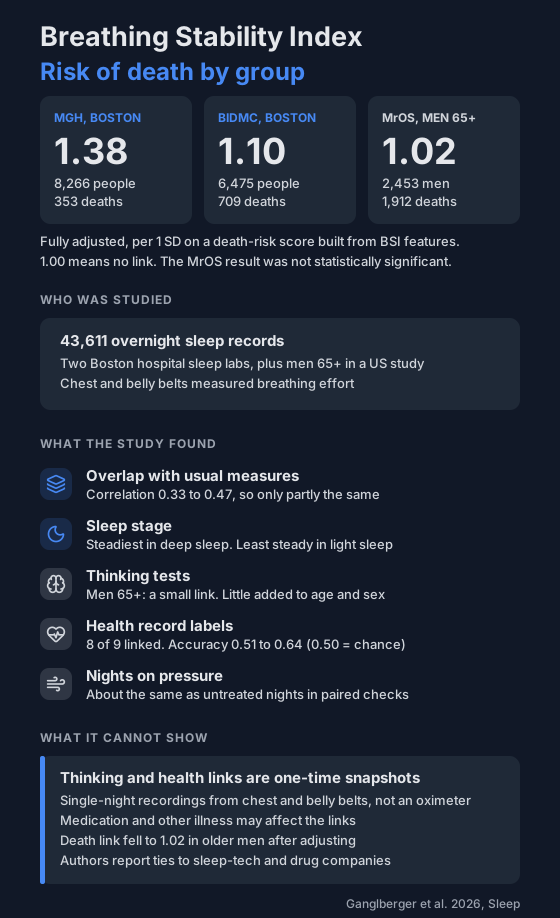
A sleep study usually boils a night down to a count of breathing events per hour. A 2026 study asks a different question: how steady is your breathing effort across the night?
The authors built a score for that, the Breathing Stability Index (BSI), and tested it on 43,611 overnight sleep study records. It added real information in some places and very little in others.
What does the score measure?
- It uses the chest and belly belts from a sleep study, which track breathing effort.
- It looks at how fast and how much that effort rises and falls, in 2-minute windows, compared with its own baseline.
- Low means steady, regular breathing, even if effort is reduced or airflow is limited.
- High means waxing and waning effort, irregular breathing or pauses.
- It doesn't need anyone to score events by hand.
The median across all nights was 1.14. On average, people spent 2.2 hours in steady breathing (5-minute stretches under 0.5) and 3.4 hours in unsteady breathing (over 1.5).
For thinking tests, health conditions and deaths, the team didn't use the single BSI number. They combined several BSI features into a separate score for each outcome.
Who was studied?
- 24,866 sleep lab studies at Massachusetts General Hospital (MGH), average age 53.
- 14,788 sleep lab studies at Beth Israel Deaconess Medical Center (BIDMC), average age 57.
- 3,768 home studies from the MrOS study, which followed men aged 65 and over (average age 77.5).
- 189 MGH studies from patients who had thinking tests within 30 days.
How did it compare with the usual measures?
It tracked them, but only partly.
- The correlations were 0.47 with breathing events per hour, 0.45 with oxygen-dip area (hypoxic burden), 0.44 with periodic breathing and 0.33 with arousals.
- It stayed linked to events per hour, arousals, periodic breathing and the ODI after each was adjusted for the others.
- Its link to oxygen-dip area shrank to almost nothing after that adjustment, though it stayed statistically significant.
- Within the same events-per-hour group, breathing was steadiest in deep sleep (N3), less steady in lighter sleep and REM sleep, and least steady in the lightest stage (N1).
- It rose with events per hour in obstructive, central and mixed patterns alike, so it isn't specific to obstructive sleep apnea.
- In paired checks, CPAP titration nights and split nights scored about the same as untreated nights (median differences 0.014 and 0.0155, neither statistically significant).
- The authors say whether the score changes with therapy still needs testing.
- On repeat untreated nights in the same person, the correlation was 0.44.
What about thinking tests?
- In MrOS, a less favourable score went with lower total test results (0.075 of a standard deviation per 1 SD of the score, 95% CI 0.043 to 0.108) and lower fluid, or problem-solving, results (0.048, CI 0.017 to 0.079), after adjusting for age and sex.
- The link with crystallized, or knowledge-based, results was not clear.
- Adding the score to age and sex changed the prediction only a little.
- In the 189 MGH patients, the score predicted fluid results (r = 0.188), but it was weak for the other two areas.
- After adjusting for age and sex, it had no significant link with thinking in that group.
- The arousal index was linked to lower results in all three areas in that group.
What about health conditions?
The team compared MGH sleep lab patients who had each of 9 conditions in their health records against patients with none of the 9, matched by age and sex.
- A higher score was linked to 8 of the 9: atrial fibrillation, high blood pressure, heart attack, type 2 diabetes, depression, dementia, bipolar disorder and a "symptomatic disease" label.
- Early cognitive decline (MCI) was the exception.
- Accuracy at telling the groups apart ranged from 0.509 (MCI) to 0.642 (atrial fibrillation).
- A coin flip is 0.5.
What about deaths?
Each place gave a different answer.
| Group | People | Deaths | Median follow-up | Fully adjusted ratio |
|---|---|---|---|---|
| MGH | 8,266 | 353 | 5.4 years | 1.38 (1.23 to 1.54) |
| BIDMC | 6,475 | 709 | 3.0 years | 1.10 (1.02 to 1.19) |
| MrOS | 2,453 | 1,912 | 12.2 years | 1.02 (0.97 to 1.06) |
- These groups are smaller than the totals above because each person counted once and needed follow-up data and complete measures.
- Ratios are per 1 standard deviation higher on a BSI death-risk score, adjusted for age, sex, events per hour, oxygen-dip area, arousals and periodic breathing.
- That score combines several BSI features, so a ratio here isn't the effect of a rise in the BSI number itself.
- The link was statistically significant at MGH and BIDMC, but not in MrOS.
- In MrOS the ratio was 1.15 before adjusting and fell to 1.02 once age and the other measures were included.
- The authors say likely reasons are differences in age, who ended up in each group, other illnesses, follow-up time and how deaths were spread.
What doesn't it tell you?
- Cause: thinking tests and health conditions were measured around the time of the sleep study, so the study can't say which came first.
- Direction: unsteady breathing may follow illness as well as add to it.
- Other factors: medication, therapy use, other illness and who ended up in each group may have affected the links, including the death results.
- How much it adds: accuracy of 0.51 to 0.64 is modest, and for thinking tests it added little to age and sex.
- Use at home: it needs chest and belly belt signals, and a finger or wrist oximeter doesn't record breathing effort, so you can't work this score out from an overnight oxygen trace.
- One night: the analyses rest on single-night recordings, which vary from night to night.
- Signal quality: the authors say they had no common measure of belt signal quality across the groups.
- Independence: two authors report ties to sleep-tech and drug companies.
- Funding: the work was funded by the US National Institutes of Health.
The authors call it a complement to the usual measures, not a replacement, and say it needs prospective testing before any clinical use.
What can you do with this?
Your oximeter records oxygen and pulse, not breathing effort, so this score isn't one you can see at home. What you can see is the shape of the night: how often oxygen dips, and whether they come in clusters. For how to read that, see what counts as an oxygen dip.
If you want a doctor to look at your overnight data, here's how to share it.
Not a medical device. Does not diagnose, treat or prevent any condition. Discuss results and changes with a clinician.
References
- Ganglberger W, Sun H, Quinn TM, Westover MB, Thomas RJ. Dynamic instability of breathing during sleep predicts cognition, disease, and mortality. Sleep. 2026;zsag212. Online ahead of print. doi:10.1093/sleep/zsag212 (PubMed 42536396)