Day vs Night Pulse Wave and Blood Pressure
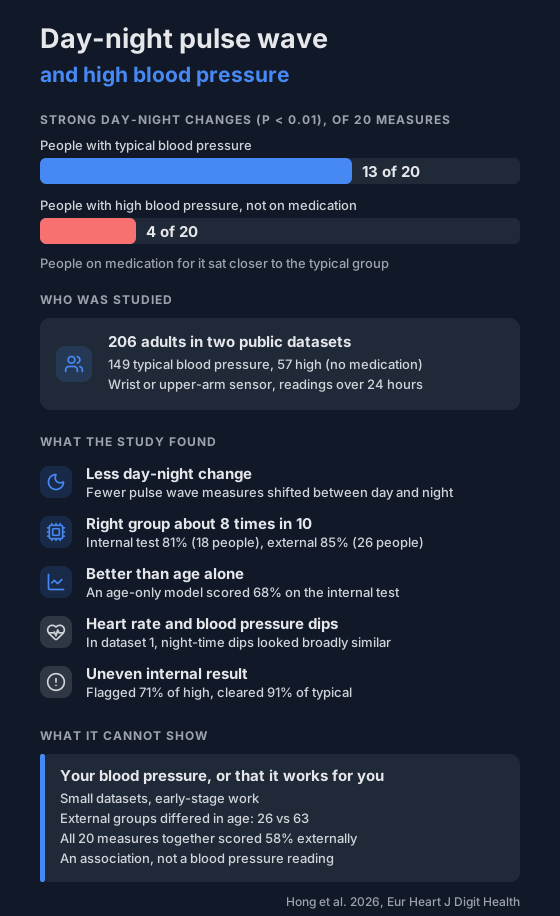
A 2026 King's College London study of 206 adults found fewer day-night changes in the pulse wave in people with high blood pressure not on medication, and the best model setups sorted people into the right group 81% of the time on 18 people and 85% on 26.
The pulse wave from a fingertip or wrist sensor isn't the same all day. It changes between waking and sleep. A 2026 study from King's College London asked whether that day-night change looks different in people with high blood pressure.
In its data, people with high blood pressure who weren't on medication showed less of it. A model built on the pattern sorted people into the right group about 8 times in 10. It was early-stage work on small datasets, and it isn't a blood pressure measurement.
What is the pulse wave?
Your oximeter or wrist sensor shines light into the skin and records how much blood is in the tiny vessels with each beat. That trace is called a photoplethysmogram (PPG), or pulse wave.
- Each beat gives a rise, a peak, and a small dip called the dicrotic notch, which marks the heart valve closing.
- The authors worked out 20 measures from each beat: 11 about timing and 9 about shape.
- Stiffer arteries can change the shape and timing.
- The authors expected high blood pressure to blunt the day-night swing in these measures.
For how the same signal behaves at sleep arousals, see blood vessel stiffening at sleep arousals.
Who was studied?
- 206 adults from two public datasets, all with a wrist or upper-arm sensor and a cuff on the other arm for 24 hours.
- Dataset 1 (Aurora-BP): 180 people used for building the model. 138 had typical blood pressure and 42 had high blood pressure and weren't on medication. Average ages were 45 and 49.
- Dataset 2 (CUHK-BP): 26 people from Hong Kong used only for a final test. 11 had typical blood pressure and 15 had high blood pressure and weren't on medication. Average ages were 26 and 63.
- A further 60 people in dataset 1 had high blood pressure and kept taking their usual medication. They were looked at but not used in the model.
- Status in dataset 1 was self-reported and labelled at the lab visit.
- Dataset 2 used a Hong Kong framework and checked against hospital records.
What was measured?
- Each person had pulse wave clips paired with a cuff reading.
- Dataset 1 used 15-second clips every 30 minutes by day and every 60 minutes at night.
- Dataset 2 used 60-second clips, trimmed to the middle 25 seconds, every 30 minutes over 24 hours.
- Awake and asleep periods came from step counts in dataset 1 and from self-reported sleep times in dataset 2. They weren't based on sleep tracking.
- For each person and each of the 20 measures, the authors tested whether the awake and asleep values differed.
- Those results, not the raw values, were what the model learned from.
- Four standard model types were tried. A support vector machine did best.
What did it find?
- Group level: 13 of the 20 measures changed strongly (P below 0.01) between awake and asleep in people with typical blood pressure. In people with high blood pressure and no medication, 4 did. Counting weaker changes too (P below 0.05), it was 18 against 7.
- On medication: that group's pattern was closer to the typical one, differing in 5 measures. The authors suggest therapy may partly restore the usual pattern, but the study didn't test that.
- Per person: 8.3% of measures changed clearly in people with typical blood pressure, against 3.2% in people with high blood pressure.
- Internal test (18 people): the best model was right 81.1% of the time (SD 8.4%) across five random splits, using all 20 measures. It flagged 71% of those with high blood pressure and cleared 91% of those with typical blood pressure.
- External test (26 people): it was right 84.6% of the time using only the 11 timing measures. All 20 measures together scored 57.7% there.
- Age alone: a model using only age scored 67.8% internally.
- What mattered most: measures linked to the dicrotic notch ranked highest in the external test.
In dataset 1, blood pressure itself dropped at night in all three groups, and dip patterns were broadly similar. In dataset 2, systolic pressure dropped at night only in the high blood pressure group. Heart rate fell in every group too, so it doesn't explain the result on its own, though the authors say it should be checked more directly.
What can't it show?
- The datasets were small, especially the external one with 26 people. Estimates could move a lot with different people.
- People needed only three valid daytime and three valid night-time readings to be included, which the authors call a low bar.
- The two external groups were very different in age, 26 against 63. The model left age out, but that gap makes the external result harder to read.
- Body mass index was higher in the high blood pressure groups in both datasets.
- The best measures differed between tests. The timing set did well externally and the full set did badly, so the 85% figure shouldn't be read as a settled performance.
- Awake and asleep were guessed from steps or self-report, not measured.
- The sensors and clip lengths differed between datasets.
- It sorted two groups only: typical and high without medication. It didn't grade high blood pressure or cover people on medication.
- It's a model result in existing data, not a test of a wearable in daily life. It doesn't measure blood pressure.
- The authors reported no conflicts of interest. Funding came from a UK research council doctoral grant and a Chinese national science foundation fund.
What can you do with it?
Nothing about your own readings changes from this study. Home oximeters don't show these pulse wave measures, and none of this is a blood pressure reading.
- If you track overnight data, see how blood pressure and oxygen dips have been linked in other studies.
- For a wearable angle, see wearables, sleep apnea and blood pressure.
- For night-time blood pressure patterns, see oxygen burden and night-time blood pressure dipping.
- If you're worried about your blood pressure, a cuff reading and a conversation with your doctor are the way to find out.
Not a medical device. Does not diagnose, treat or prevent any condition. Discuss results and changes with a clinician.
References
- Hong J, Nandi M, Zheng Y, Alastruey J. Hypertension screening via awake-sleep differences in photoplethysmogram signals. European Heart Journal - Digital Health. 2026;7(7):ztag131. doi:10.1093/ehjdh/ztag131