How Close Is Wearable HRV to an ECG?
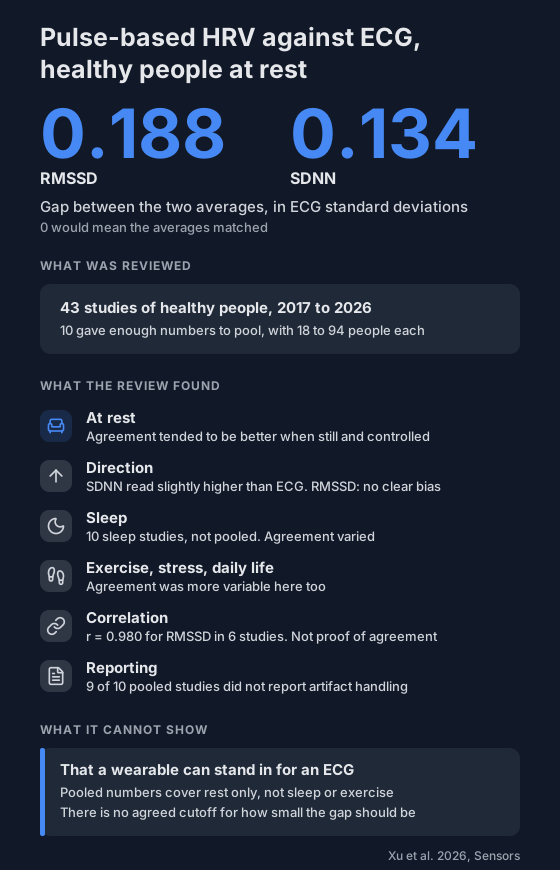
A 2026 review of 43 studies compared heart rate variability from optical pulse sensors with ECG. At rest the two averages sat 0.13 to 0.19 ECG standard deviations apart. Sleep and exercise results were not pooled.
Watches, rings and phone cameras report heart rate variability (HRV) from a light sensor on your skin. An ECG measures it from the heart's electrical signal. The light sensor times the pulse reaching your wrist or finger, so strictly it gives pulse rate variability.
An August 2026 review asked how close the two are.
What did the review look at?
- 43 studies published from 2017 to May 2026, all in healthy people: adults, athletes and adolescents.
- Sensors on the wrist, upper arm, finger, ear and ring, plus phone cameras.
- Two common HRV measures, RMSSD and SDNN.
- Only 10 studies reported enough numbers to pool, each with 18 to 94 people measured at rest or in similar controlled conditions.
How close were they at rest?
The authors divided the gap between the average sensor reading and the average ECG reading by the ECG standard deviation. Zero would mean the averages matched.
- RMSSD: 0.188 (8 studies).
- SDNN: 0.134 (8 studies).
- SDNN from the light sensor read slightly higher than ECG (p = 0.029).
- RMSSD showed no statistically significant lean either way.
- In six studies the two RMSSD readings rose and fell together (r = 0.980), though results differed widely between studies.
The authors say a high correlation is not the same as agreement. There is also no accepted cutoff for how small the gap should be.
What about during sleep?
The pooled numbers don't cover it.
- 10 studies involved sleep or overnight recording, and they weren't pooled.
- Agreement in them appeared more variable than at rest.
- So did exercise, stress tasks and daily life.
- The authors point to movement, sensor contact and skin blood flow.
See how sensor fit and pressure change a reading.
What can't it tell you?
- It doesn't show that a wearable can stand in for an ECG.
- The gap is between group averages, not one person's readings.
- 9 of the 10 pooled studies didn't report how they handled bad signal.
- The SDNN result lost statistical significance when either of two single studies was removed.
- Everyone was healthy. See who wearable studies leave out.
What can you do with this?
The authors suggest using pulse-based HRV to follow your own trend on one device.
- Measure at the same time of day, in the same position.
- Wear the sensor in the same place.
- Read it alongside how you slept and how you feel.
Related: overnight heart rate swings.
Not a medical device. Does not diagnose, treat or prevent any condition. Discuss results and changes with a clinician.
References
- Xu S, Liu H, Liu Z, Su P, Gu Z. Accuracy of Photoplethysmography-Derived Pulse Rate Variability Compared with Electrocardiography-Derived Heart Rate Variability: A Systematic Review and Meta-Analysis. Sensors (Basel). 2026;26(16):5192. doi:10.3390/s26165192