Early Infection Signs in Wearable Data
A 2026 study of 435 Fitbit users found that changes from each person's own recent baseline in steps, sleep and heart rate flagged infections about 5 days before confirmation. Daily values compared with all users did much worse.
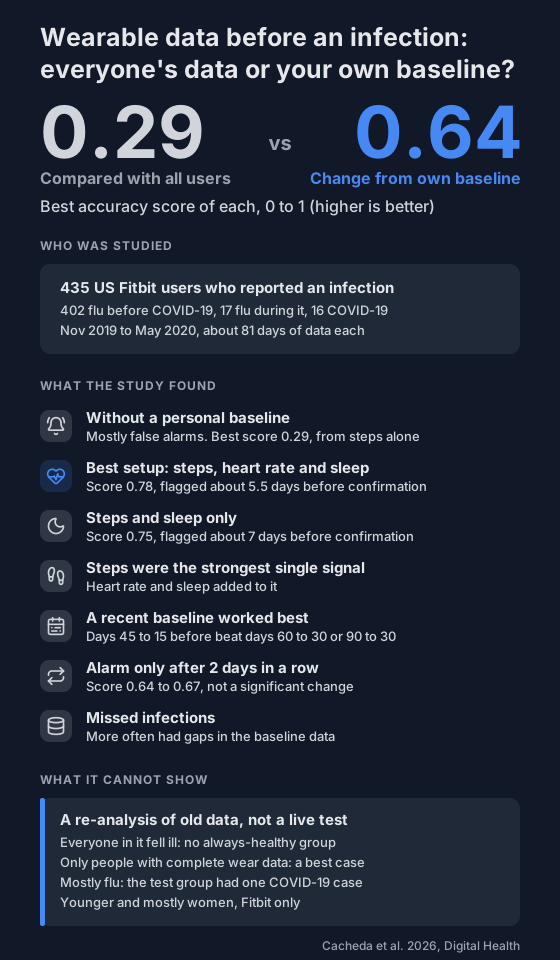
Your watch or ring shows a resting heart rate, a step count and hours of sleep. On their own, those numbers don't say much, because everyone's typical range is different. A 2026 study asked whether comparing each person with their own recent weeks works better.
It did, by a wide margin.
Who was in the study?
- 435 Fitbit users in the US, from a public dataset collected between November 2019 and May 2020.
- Everyone had reported an infection: 402 had flu before COVID-19 arrived, 17 had flu during the early pandemic and 16 had COVID-19.
- Each had about 81 days of data on average.
- Only people who wore the device every day for the 10 days before their illness was confirmed were included.
The authors call day 0 the day each person said the illness was confirmed. They then asked computer models to raise an alarm in the 10 days before it.
How was it scored?
Two numbers, so here's what they mean:
- Accuracy score (F1), 0 to 1. It balances two things: how many infections got an alarm, and how many alarms were right. An alarm more than 10 days before confirmation counted as false.
- Earliness, 0 to 1. How many days ahead the alarm came, divided by 10. So 0.5 means about 5 days before confirmation.
What did they find?
Numbers without a personal baseline did badly. Fed the daily steps, heart rate and sleep, plus how each compared with all users combined, the best model scored 0.29. Most of its alarms were false.
Your own baseline did much better. The authors added a few numbers per signal: how far the last 2 to 4 weeks sat from that person's own healthy weeks. The best score rose to 0.64. That gap was statistically significant.
With further tuning, the best setups were:
- Steps, heart rate and sleep together: score 0.78, with alarms about 5.5 days before confirmation on average.
- Steps and sleep only: score 0.75, about 7 days before confirmation.
Which signals mattered most?
- Steps were the strongest single signal in almost every setup. The authors think that's because people move less as they get ill.
- Heart rate and sleep added to it, and the best results used all three.
- A recent baseline worked best. Comparing with days 45 to 15 before beat days 60 to 30, by a statistically significant margin. Going back to day 90 didn't help.
- The simplest model did best. A basic statistical model beat two more complex machine-learning ones.
- Waiting for 2 days in a row above the alarm line nudged the score from 0.64 to 0.67. That change was not statistically significant.
- Missed infections more often had gaps in the baseline weeks.
What can't it show?
Quite a lot, and the authors list most of it themselves:
- It's a re-analysis of old data. Nothing was tested live on people as they got ill.
- Everyone in it got ill. There was no group of people who stayed healthy, so false alarms were only counted on these people's healthy days.
- Only people with complete data in the 10 days before were included. The authors call the 0.78 an upper limit; gaps from taking a device off would likely lower it.
- It's mostly flu. The test group, a fifth of the people held back to check the models, had one COVID-19 case.
- Participants were younger and mostly women, and only Fitbit data was used.
- Illness dates came from what people reported, not from medical records.
What can you take from it?
The main lesson goes beyond infections: a number means more next to your own recent weeks than next to a population average.
That applies to overnight oxygen too:
- Record enough baseline nights before you compare anything. See how many nights to record.
- Keep the baseline recent. In this study, a baseline from about 2 to 6 weeks back beat older data.
- Gaps weaken a baseline. Wear the device on as many nights as you can.
- One odd night is just one odd night. Look for a change that holds over several.
For how far you can trust the numbers in the first place, see how valid smartwatch health numbers are. If something in your data worries you, take it to your doctor. Here's how to share it.
Not a medical device. Does not diagnose, treat or prevent any condition. Discuss results and changes with a clinician.
References
- Cacheda F, Carneiro V, Álvarez MA, López-Vizcaíno MF. Early detection of infectious diseases using wearable sensor data through personalized baseline deviation modelling. Digital Health. 2026;12:20552076261477919. doi:10.1177/20552076261477919