Time Below 90% and Cholesterol: A CPAP Study
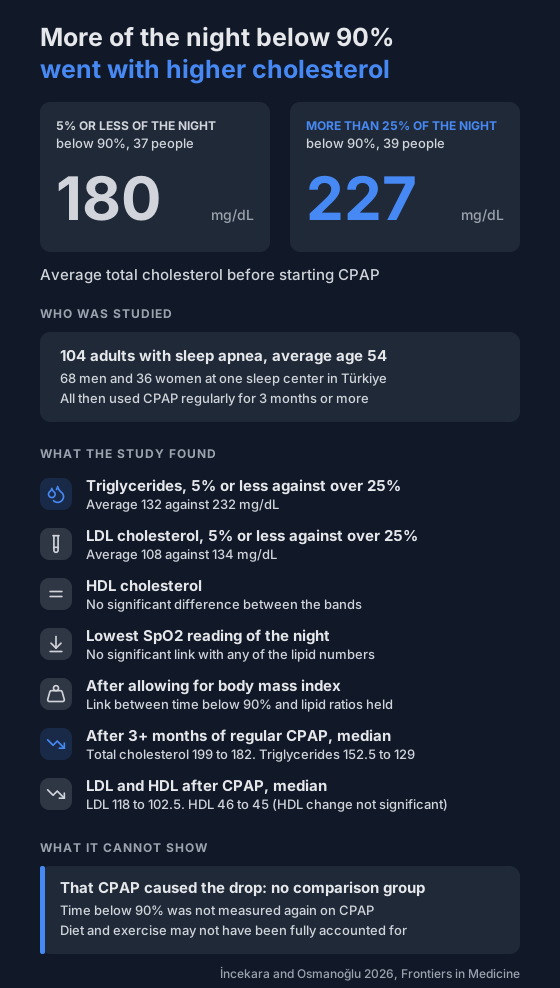
In 104 adults with sleep apnea, a larger share of the night below 90% SpO2 went with higher cholesterol and triglycerides. After 3 or more months of regular CPAP use, total cholesterol, LDL and triglycerides were lower. There was no comparison group.
An overnight oxygen report gives you several numbers. Two of them are the lowest reading of the night and the share of the night spent below 90%, called T90.
A study published in April 2026 compared both with blood fats in 104 adults with sleep apnea. The share of the night below 90% went with higher cholesterol and triglycerides. The lowest reading didn't.
Who was in the study?
- 104 adults at one sleep center in Karaman, Türkiye: 68 men and 36 women.
- Their average age was 54 and their average BMI was 32.9.
- All had 15 or more breathing events per hour on an overnight sleep study. The average was 57.
- All of them started CPAP and used it for at least 4 hours a night on at least 70% of nights, for 3 months or more. The machine's own records confirmed it.
- People who started or changed a cholesterol-lowering medicine between the two blood tests were left out.
- It was a cohort study. The sleep study and first blood test came from routine care records from January 2022 to June 2025, and the second blood test was a planned follow-up visit.
What was measured?
- The share of sleep time with SpO2 below 90%, from the sleep study before CPAP.
- The lowest SpO2 of the night.
- A fasting blood test before CPAP and again after at least 3 months on it: total cholesterol, LDL, HDL and triglycerides.
- Three ratios worked out from those results. The paper calls them atherogenic indices.
The authors split people into four bands by share of the night below 90%:
- 5% or less: 37 people
- Over 5% to 10%: 13 people
- Over 10% to 25%: 15 people
- Over 25%: 39 people
On average the group spent 20% of the night below 90%.
What went with more time below 90%?
Mean results before CPAP, the 5% or less band against the over 25% band:
- Total cholesterol: 180 mg/dL against 227 mg/dL.
- LDL cholesterol: 108 mg/dL against 134 mg/dL.
- Triglycerides: 132 mg/dL against 232 mg/dL.
- HDL cholesterol: 46 mg/dL against 47 mg/dL, no significant difference.
The differences between these two bands were statistically significant for everything except HDL. All three ratios were also significantly higher in the over 25% band than in the 5% or less band.
The two middle bands were small.
- The over 5% to 10% band had significantly lower triglycerides (mean 125 mg/dL) and a lower triglyceride-to-HDL index than the over 25% band. It wasn't significantly different from the 5% or less band on either.
- On total cholesterol, LDL and the other two ratios, it wasn't significantly different from either end.
- The over 10% to 25% band wasn't significantly different from either end on any of them.
BMI and breathing events per hour were also significantly higher in the over 25% band than in the 5% or less band. The authors ran a model that adjusted for BMI, and the link between time below 90% and the three ratios remained.
What about the lowest reading of the night?
The average lowest SpO2 was 75%. The authors report no significant correlation between it and cholesterol, triglycerides or the ratios. The text of the paper gives no figures for this result.
The authors give two possible reasons. A single lowest point may not capture how long oxygen stayed low. Or the study may have been too small to find a link.
What changed after CPAP?
Median results before and after at least 3 months of regular CPAP use, in all 104 people:
- Total cholesterol: 199 to 182 mg/dL, 8.5% lower.
- LDL cholesterol: 118 to 102.5 mg/dL, 13.1% lower.
- Triglycerides: 152.5 to 129 mg/dL, 15.4% lower.
- HDL cholesterol: 46 to 45 mg/dL, not a significant change.
The medians of the three ratios were lower too. The drops in total cholesterol, LDL, triglycerides and the ratios were statistically significant.
This is a before and after comparison in one group. It doesn't show that CPAP lowers cholesterol.
What doesn't it tell you?
The authors list these limits:
- It was one center and an observational study, which limits what it can say about cause.
- Diet and physical activity may not have been fully accounted for.
- People who changed cholesterol-lowering medicine were left out, but the authors say some leftover effect is possible.
- The lack of a link with the lowest SpO2 may be down to the study's size.
These points are ours, from reading the methods and tables:
- No comparison group. Everyone used CPAP, so the before and after change can't be put down to CPAP.
- Time below 90% wasn't measured again on CPAP. The paper says so in its methods, and that the authors presumed it had fallen.
- Weight at follow-up isn't reported.
- The model adjusted for BMI only. Age, sex and smoking were checked and left out. Breathing events per hour wasn't in the model.
- Irregular CPAP use. Only people who met the usage threshold were included.
- Other groups. Everyone had at least 15 breathing events per hour.
- Heart outcomes. The study measured blood test results, not heart attacks or strokes.
What can you do with this?
Time below 90% is one of the figures an overnight oximeter records. What is T90 explains how it's counted.
If yours is often above zero, share your recordings with your doctor. Cholesterol and triglycerides need a blood test, so that's a conversation for the same appointment.
On CPAP already? See tracking your oxygen alongside CPAP.
For another study on this measure, read time below 90% and heart failure outcomes.
Not a medical device. Does not diagnose, treat or prevent any condition. Discuss results and changes with a clinician.
References
- İncekara Y, Osmanoğlu UÖ. Hypoxemia burden and atherogenic indices in OSAS: changes after CPAP therapy. Frontiers in Medicine. 2026;13:1775054. doi:10.3389/fmed.2026.1775054