Temperature Swings and Sleep Apnea Study
Smartwatch data from 52,752 people in China linked bigger outdoor temperature swings to slightly more breathing events and slightly lower overnight SpO2. The per-degree changes were very small.
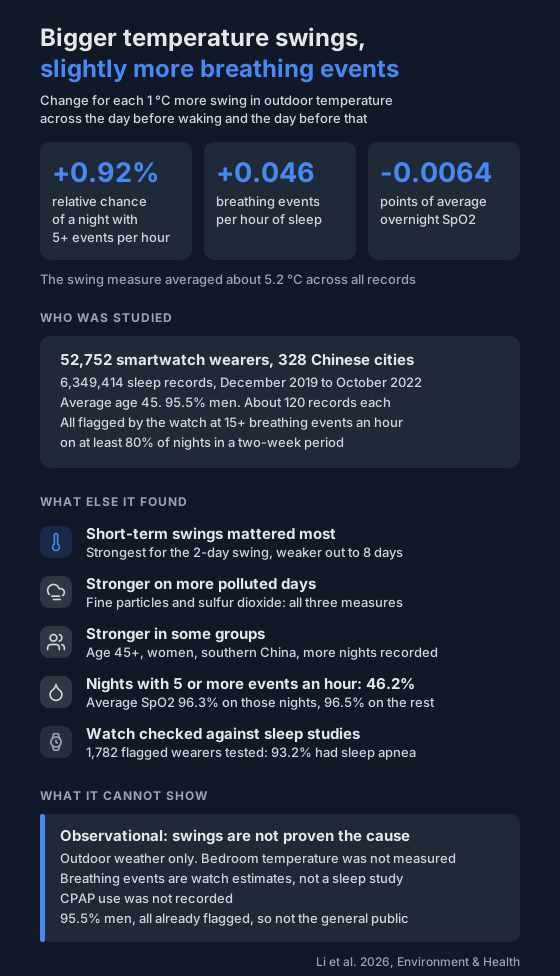
Some studies have linked hotter weather to more breathing events during sleep, though results are mixed. This study asked a different question: does it matter how much the outdoor temperature swings from day to day?
It used smartwatch data from 52,752 people in China. Bigger swings went with slightly more breathing events and slightly lower overnight SpO2. The changes per degree were very small.
Who was studied?
- 52,752 adults in 328 Chinese cities who wore a Huawei smartwatch to bed, between December 2019 and October 2022.
- 6,349,414 days of sleep records, about 120 per person. 97.1% were night-time sleep.
- Average age 45.4, and 95.5% were men.
- 30.5% had a BMI of 28 or more, 28.7% reported high blood pressure and 5.6% reported diabetes. Up to 28.6% left these questions blank.
Everyone in it had already been flagged by the watch as at higher risk of sleep apnea. That meant 15 or more estimated breathing events per hour on at least 80% of nights in some two-week period. People with lower readings were left out.
The watch estimates breathing events and SpO2 from the light sensor on the wrist. It isn't a sleep study. 1,782 of the flagged wearers did have a hospital sleep study, and 93.2% of them were found to have obstructive sleep apnea.
For more on what watch figures can and can't tell you, see how valid smartwatch numbers are.
How was a temperature swing measured?
- The researchers took the highest and lowest outdoor temperature for each day, from weather data for the person's home district.
- The swing was the spread (standard deviation) of those highs and lows over the day before waking and the day before that.
- It averaged about 5.2 °C across all records.
- They also tested longer windows, up to 8 days.
Each person was compared with themselves on other days in the same month. The models also adjusted for average temperature, humidity, wind, day of the week and holidays.
What did they find?
For each 1 °C more swing over the two days:
- The chance of a night with 5 or more breathing events per hour was 0.92% higher (95% confidence interval 0.69% to 1.15%). That's a relative change, not 0.92 percentage points. Across the whole study, 46.2% of recorded days were like that.
- Breathing events went up by 0.046 per hour (0.036 to 0.057).
- Average overnight SpO2 went down by 0.0064 percentage points (0.0059 to 0.0068).
The link was strongest for the two-day swing and got weaker as the window stretched to 8 days.
How small is that?
Very small for one person on one night.
- On nights with 5 or more events per hour, the figure the paper gives is 30.68 events per hour. The per-degree change was 0.046.
- Average SpO2 was 96.30% on those nights and 96.50% on the others. The per-degree change was 0.0064 points.
The paper doesn't say this, but for context: most consumer oximeters show SpO2 in whole points, so a change that size won't show up on a single night. A study with 6.3 million records can pick up effects far too small to see in one person's data. The result says something about a large group, not about what you'll notice after a cold snap.
Where does air pollution come in?
The researchers split each day into higher or lower pollution, using the median level of each of five pollutants. The link between swings and breathing was stronger on higher-pollution days:
- Fine particles (PM2.5) and sulfur dioxide: on all three measures.
- Coarse particles: for events per hour and for SpO2.
- Nitrogen dioxide: for nights with 5 or more events per hour and for events per hour.
- Carbon monoxide: for nights with 5 or more events per hour. The text also lists events per hour, but the table gives p = 0.056 for that one, just over the paper's own 0.05 cut-off.
The paper reports these as interaction terms. The main text doesn't give a plain per-degree figure for high and low pollution days.
After adjusting for the five pollutants, the main link got slightly smaller but held.
Did it differ between groups?
The link was stronger in:
- People aged 45 and over.
- Women, though only 2,348 of the 52,752 were women.
- People in southern China.
- People with more nights recorded.
The numbers for each group are in the paper's supplement.
What can't it show?
- Cause. It's an observational study. The authors suggest possible reasons, but didn't test them.
- Your bedroom. Only outdoor weather was used. Indoor temperature, heating and air conditioning weren't measured.
- Sleep-study accuracy. The events are a watch's estimates. The authors say temperature itself may affect how well the watch measures, and that the watch's checks haven't been widely published because of commercial confidentiality.
- CPAP. Nobody recorded who was on CPAP. The authors say use is low in China.
- Everyone. The group was 95.5% men, all flagged at higher risk. It may not apply to the general population.
- Pollution where you live. Readings came from the nearest monitoring station, up to 50 km away.
What can you do with this?
Not much on a single night.
- If your overnight numbers shift after a change in the weather, this study doesn't tell you the weather did it.
- One odd night is more likely ordinary night-to-night variation. Here's how many nights to record before comparing.
- You can't control outdoor swings, but you can log your bedroom temperature and air and see whether your own recordings line up with it.
- A related study looked at bedroom temperature and overnight heart rate variability.
If you snore loudly, someone has seen you stop breathing in your sleep, or you're worn out during the day, talk to a doctor.
Not a medical device. Does not diagnose, treat or prevent any condition. Discuss results and changes with a clinician.
References
- Li A, Wang H, Zhang Q, Zhu X, Xu C, Shi S, Kan H, Guo Y, Chen R, Meng X. Nationwide Study of the Association between Temperature Variability and Sleep Apnea, and the Modifying Role of Air Pollution, in a Moderate-to-Severe Risk OSA Population. Environment & Health. 2026;4(2):202-211. Published online 16 September 2025. doi:10.1021/envhealth.5c00045