Home Oximeters in COVID: A Manchester Study
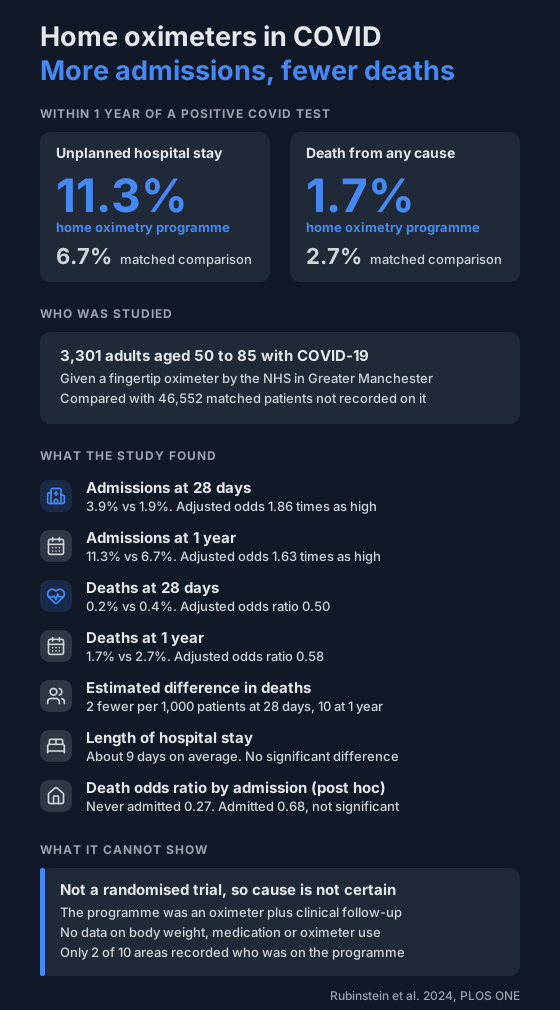
A 2024 study compared 3,301 COVID patients given an NHS home oximeter with 46,552 matched patients. Within a year, 11.3% vs 6.7% had an unplanned hospital admission and 1.7% vs 2.7% died.
During the pandemic, the NHS in England gave fingertip pulse oximeters to people with COVID-19 so they could check their oxygen at home. The idea was to catch falling oxygen early and get people to the right care.
A 2024 study from Greater Manchester looked at what happened to those patients over the next year. Compared with matched patients, they went to hospital more often and fewer of them died. The study was not a randomised trial, so it cannot show the programme was the cause.
What was the programme?
It was called "COVID-19 oximetry at home".
- It was offered to people with COVID-19 who were older, clinically vulnerable or judged by a clinician to be at high risk of getting worse.
- They took readings at home with an OxyWatch fingertip oximeter made by ChoiceMMed.
- A low reading led to a same-day review by a clinician at home, or an ambulance to hospital if it was more urgent.
- People who had not got worse 14 days after their symptoms began were discharged with advice on what to watch for.
So the programme was a pathway into care, with an oximeter as one part of it.
Who was studied?
- 3,301 adults aged 50 to 85 with a positive COVID-19 test between February 2020 and June 2022, recorded as enrolled in the programme in 2 areas of Greater Manchester.
- 46,552 comparison patients from all 10 areas who were not recorded as enrolled.
- The two groups were matched on sex, age, test date, other illnesses, ethnicity, deprivation and hospital admissions in the previous year.
- The average age was 64, about half were men and about a third had diabetes.
The researchers used linked GP and specialist health records. They followed each person for up to a year.
What did it find?
These figures are from the main comparison, against matched patients from all 10 areas.
Unplanned hospital admissions were more common in the oximetry group:
| Oximetry group | Comparison group | Adjusted odds ratio | |
|---|---|---|---|
| 28 days | 3.9% | 1.9% | 1.86 |
| 90 days | 7.2% | 4.4% | 1.50 |
| 1 year | 11.3% | 6.7% | 1.63 |
Deaths from any cause were less common:
| Oximetry group | Comparison group | Adjusted odds ratio | |
|---|---|---|---|
| 28 days | 0.2% | 0.4% | 0.50 |
| 90 days | 0.6% | 1.2% | 0.50 |
| 1 year | 1.7% | 2.7% | 0.58 |
- The researchers estimated 2 fewer deaths per 1,000 patients at 28 days, 6 at 90 days and 10 at 1 year.
- For people admitted within 90 days, hospital stays were about 9 days on average, with no statistically significant difference between the groups.
Did it hold up with other comparison groups?
Only 2 of the 10 areas recorded who was on the programme. In the other 8, some comparison patients may have been on it without it showing in their records.
So the researchers ran the comparison three ways: against all 10 areas, against the other 8 areas, and against patients in the same 2 areas.
- The direction was the same each time: more admissions, fewer deaths.
- The link with admissions was weakest within the same 2 areas, with adjusted odds ratios of 1.32 to 1.36.
- At 28 days, the difference in deaths was not statistically significant in two of the three comparisons.
- At 90 days and 1 year, it was significant in all three.
The authors note the same-area comparison avoids that recording problem but may be more open to other differences in who was enrolled.
Was it the hospital stays that made the difference?
The authors thought earlier admission might explain part of the lower death rate. An analysis they added afterwards found the link with fewer deaths was not limited to people who went to hospital.
- Among people with no hospital admission, the adjusted odds ratio for death was 0.27.
- Among people with at least one unplanned admission, it was 0.68, and that result was not statistically significant.
The authors say the link may be clearest in people who were less ill, and may not always run through a hospital stay.
What doesn't it tell you?
- Cause: nobody was randomly assigned, and the authors say they "can never be certain on causality".
- What the oximeter did on its own: the programme also gave people a route to a clinician, and knowing they were being monitored may have changed how patients and families acted.
- Whether people used it: there was no data on whether patients followed the programme.
- Hidden differences: body weight and prescriptions were not in the data, and people who were offered the programme and said no may be in the comparison group.
- Anything outside COVID-19: everyone was aged 50 to 85 and had a positive test.
- Skin tone: the authors point to other research showing oximeter accuracy varies with skin pigmentation, and say subgroup analysis may be needed (see the NHS home oximeter skin tone study).
- Cost: the study did not look at whether the programme was good value.
One earlier trial in the US added oximeters to a text-message monitoring service. Its interim analysis found no significant difference between groups in hospital stays or deaths at 30 days, though few events had been counted.
What can you do with this?
The readings in this study went to a clinical team who acted on them. That is not the same as checking a number on your own.
- If you're unwell and worried about your breathing, contact a doctor or emergency services without waiting for a reading.
- If you take readings at home, know how accurate a pulse oximeter is and which finger to use.
- If you track oxygen over time, you can share the data with your doctor.
Not a medical device. Does not diagnose, treat or prevent any condition. Discuss results and changes with a clinician.
References
- Rubinstein F, Williams R, Dumville J, Kane B, Whittaker W, Bower P, Kontopantelis E. Patient use of pulse oximetry to support management of COVID-19 in Greater Manchester: A non-randomised evaluation using a target trial approach. PLoS One. 2024;19(11):e0310822. doi:10.1371/journal.pone.0310822