Which Overnight Oxygen Measures Stood Out?
A 2026 study tested eight overnight oxygen measures against sleep test results. A mix of four scored best and the dip index alone came close. It's a research model, not a home test.
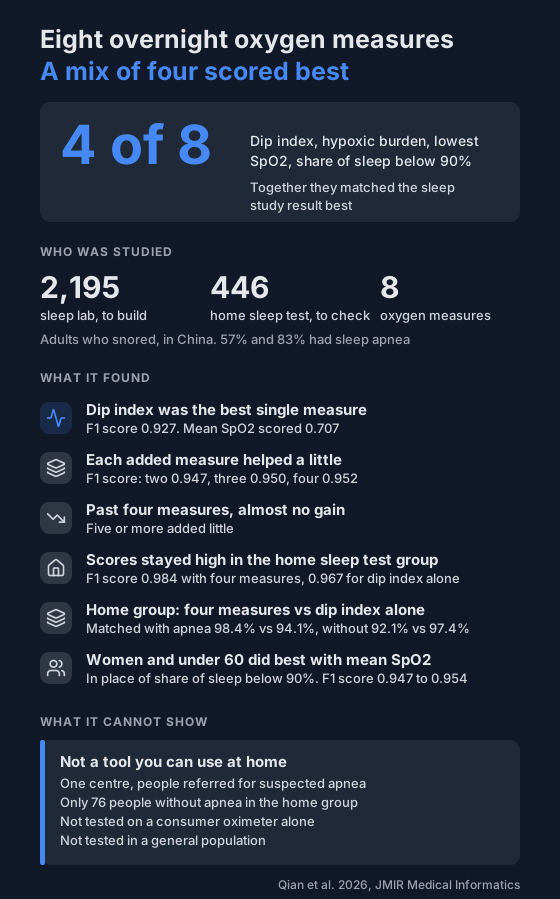
An overnight oximeter reports several numbers. It's easy to wonder which ones carry the most information. A 2026 study from Shanghai tested eight of them against sleep test results, and a mix of four scored best.
This is a research model. Your oximeter and PulseOxTracker don't use it or give you a result like it.
What did the study do?
- It used 2,195 adults who snored and had an overnight sleep lab study. Their median age was 45, and 75% were men.
- It checked the result in a separate group of 446 people who did a home sleep test, which recorded airflow, breathing effort and finger SpO2. Their median age was 60.
- Sleep apnea meant 5 or more breathing events per hour on the sleep lab study or home sleep test. 57% of the lab group and 83% of the home group met that.
- People with heart failure, COPD or kidney disease were left out, along with anyone on sleep or mood medication or who had had sleep apnea care before.
The team pulled eight measures from each person's oxygen trace. Then they trained six machine learning methods to predict who had sleep apnea from those measures.
Which eight measures?
- Oxygen dip index (ODI): dips of 4% or more per hour of sleep. See what ODI is.
- Hypoxic burden: the total area of the dips, so it counts depth, length and how often.
- Lowest SpO2 for the night.
- Average SpO2 for the night.
- Time below 90% (T90) and its share of sleep (ST90). See what T90 is.
- Two more technical measures: attention entropy, for how complex the trace was, and a spectral power value, for repeating swings in it.
Which ones scored best?
The study scored each model with an F1 score, where 1.0 is a perfect match with the sleep test result.
- On its own, the dip index scored best at 0.927, then hypoxic burden at 0.904.
- Average SpO2 scored 0.707 and the spectral power value 0.671.
- Two measures (dip index and hypoxic burden) scored 0.947.
- Adding lowest SpO2 gave 0.950.
- Adding share of sleep below 90% as a fourth gave 0.952, the best overall result.
- Five or more measures added little.
Dip index, hypoxic burden and lowest SpO2 were the biggest contributors inside the four-measure model. Their importance scores were 0.437, 0.320 and 0.137.
The authors also found that most of these measures didn't relate to sleep apnea in a straight line. The predicted chance of sleep apnea, for example, rose steeply at lower dip index values and then flattened.
Did it hold up in the home sleep test group?
Scores stayed high. In the 446-person home group, the four-measure model scored 0.984 and the dip index alone scored 0.967. The four-measure model matched the home sleep test for 98.4% of people with sleep apnea and 92.1% of those without. The dip index alone matched 94.1% and 97.4%, so it missed more people with sleep apnea and mislabelled fewer without it.
There were only 76 people without sleep apnea in that group, so those second figures rest on a small number. The authors note the small group. F1 scores also run higher when most people in a group have the condition, and 83% did here. That last point is ours, not the authors'.
Did it differ by sex or age?
Slightly.
- For men and for people 60 and over, the four measures above worked best.
- For women and people under 60, average SpO2 worked better than share of sleep below 90%.
- Scores in the lab group ran from 0.946 for men to 0.970 for people 60 and over.
The authors link the pattern in women to a possibly more constant lower oxygen level. That's their reading, and the study wasn't built to test it.
What can't it tell you?
- How it works in the general population. Everyone was an adult who snored, and the lab group came from one hospital and was referred for suspected sleep apnea. That raises the share who had it, which can make a model look better than it would elsewhere.
- Anything about the future. There was no follow-up.
- Skin tone. The cohort wasn't diverse, and oximeters can read differently on darker skin.
- Real-world use. The model was built after the fact on recordings that already existed. Nobody used it live.
- How it works on a consumer oximeter. The oxygen traces came from sleep lab and home sleep test equipment. The study didn't test a consumer oximeter on its own.
- A clean comparison. This one's our note, not the authors'. In both groups, sleep apnea was scored from the same recording as the oxygen trace, and some breathing events only counted if they came with a 4% oxygen dip. So the two overlap, which makes some match expected.
What can you do with this?
The takeaway is about which numbers this model relied on, not a test you can run. If you track your own nights, the dip index, hypoxic burden, lowest SpO2 and share of sleep below 90% are the ones that scored best together here. Your device may show some of them. A home oximeter isn't a sleep study, and the numbers don't tell you whether you have sleep apnea.
If you snore loudly or wake unrefreshed, try the sleep apnea risk check. You can share your recordings with your doctor. For how an AI reading of oximetry compared to sleep studies, see AI and overnight oximetry accuracy.
Not a medical device. Does not diagnose, treat or prevent any condition. Discuss results and changes with a clinician.
References
- Qian X, Luo H, Ding R, Gao T, Wang H, Wu P, Li N. Machine Learning-Based Multidimensional Oximetry for Obstructive Sleep Apnea Screening: Development and External Validation. JMIR Medical Informatics. 2026;14:e80384. doi:10.2196/80384