Reading the overnight chart
How to read the SpO₂ and heart-rate trace for a night, and the dips and movement trend.
Updated 2026-10-15
Every session opens on its overnight chart, a single view of how your blood oxygen and heart rate moved across the night.
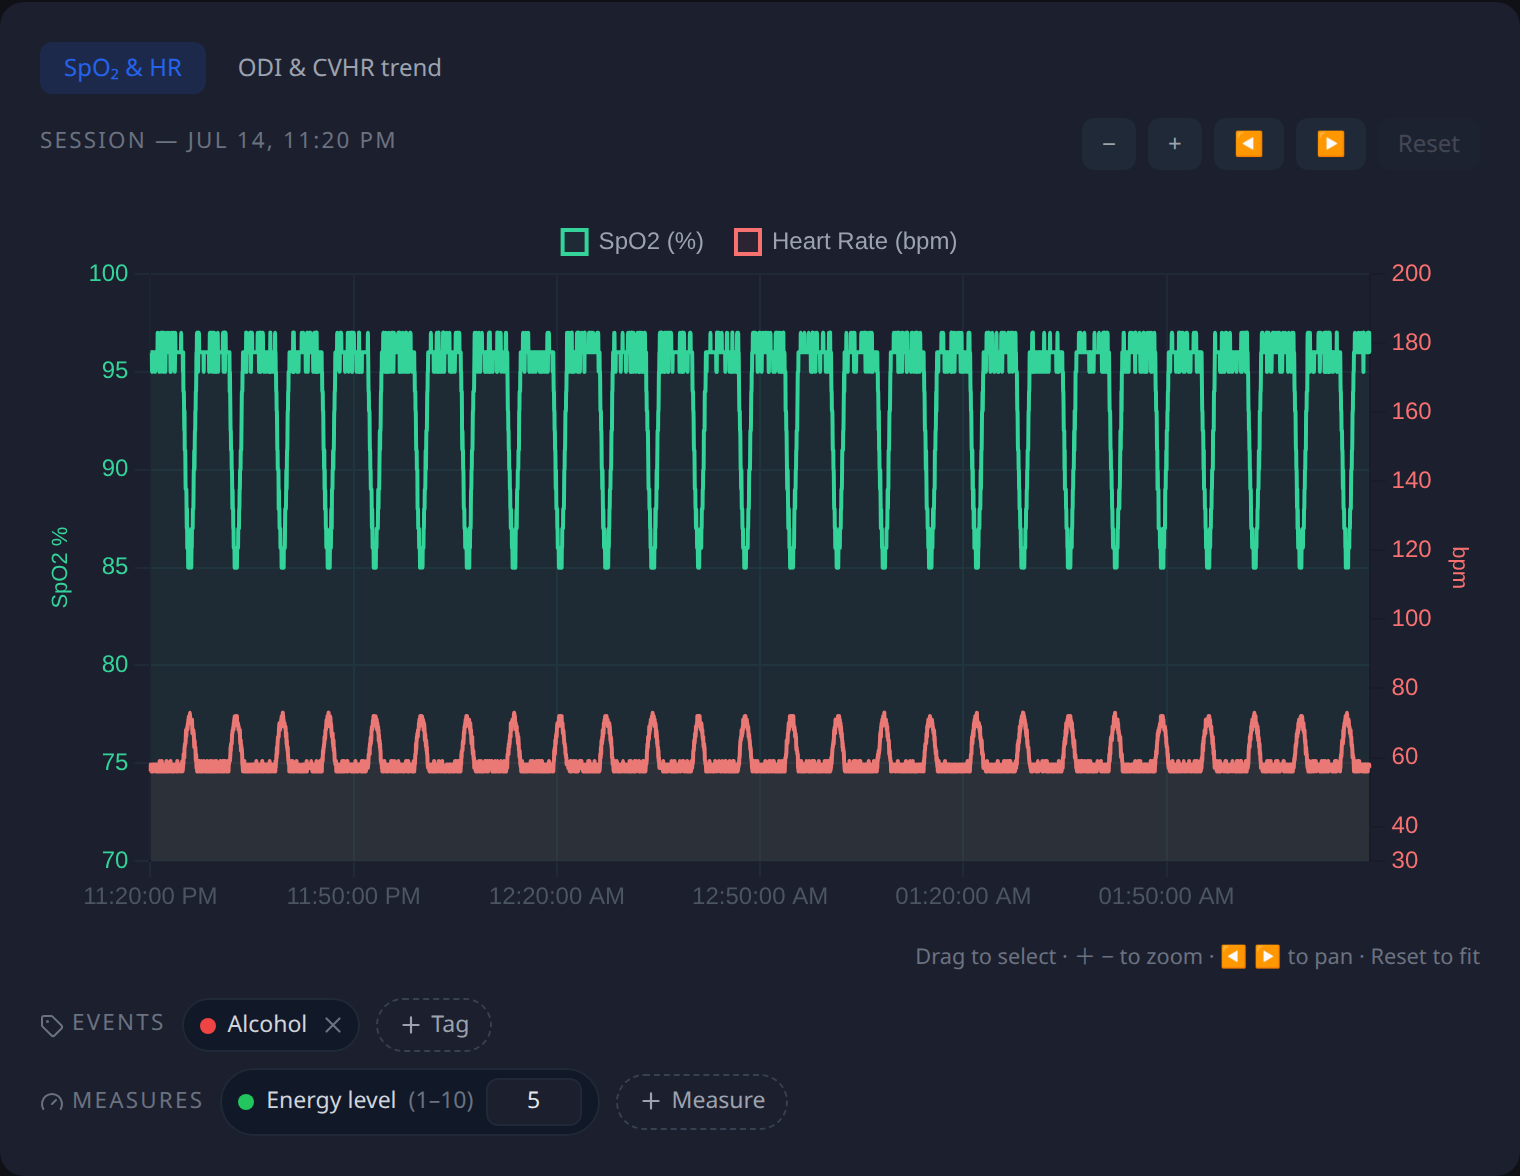
The two lines
- SpO₂ (green, left axis) runs 70–100%. A steady night stays near the top; sharp dips are desaturation events.
- Heart rate (red, right axis) runs 30–200 bpm. Look for the cyclic rises that often pair with desaturations.
Zoom and pan
- Use the −/+ controls to zoom the time axis, and the ◀/▶ arrows to pan.
- Drag across a region to select it for closer analysis.
- Hit reset to return to the full night.
Zoom into a cluster of dips to see whether they line up with heart-rate swings. That pairing is the signature of cyclic variation of heart rate (CVHR).
The dips and movement tab
Switch to Dips & movement above the chart to see the night split into about 30 equal windows, roughly 15 minutes each on a 7 to 8 hour night. The line under the chart gives the exact window length.
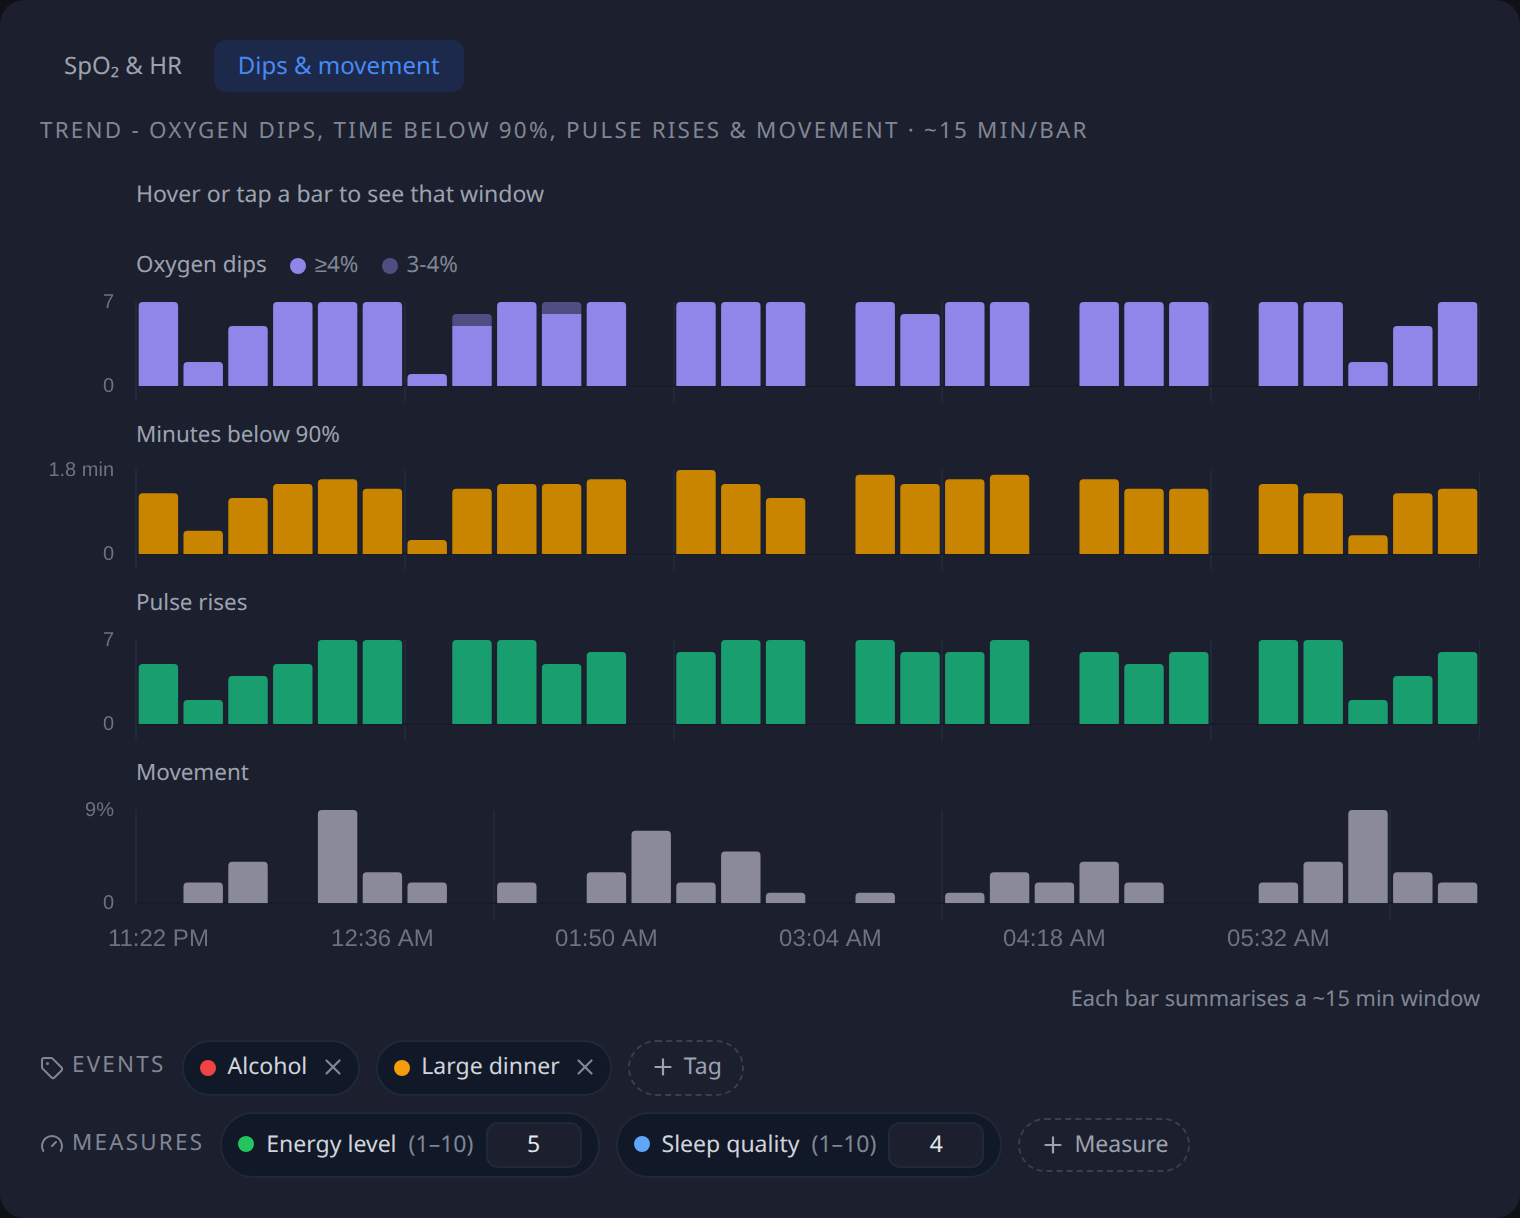
Each row has its own scale, marked with 0 and the highest value that night, and all four share the same time axis.
- Oxygen dips counts the drops of 3% or more that started in each window. The solid part of the bar is the dips that reached 4% or more, the lighter part the ones between 3% and 4%.
- Minutes below 90% is how long SpO₂ read under 90% in that window.
- Pulse rises counts surges of 6 bpm or more above your recent pulse, lasting 10 to 60 seconds. Rises during movement are left out, because the pulse reading is unreliable then.
- Movement is the share of the window the device recorded you moving.
Hover over or tap a bar to see every value for that window in the line above the chart. Look at how the rows line up: dips that come with pulse rises, or pulse rises that come with movement, show up as bars in the same column.
Next, see what the numbers behind the chart mean in overnight analysis metrics.