Last Meal 3 Hours Before Bed: A 2026 Trial
In a 2026 trial of 39 adults, eating the last meal at least 3 hours before bed for about 7.5 weeks went with a lower night-time heart rate. Insulin sensitivity, a co-primary outcome, showed no statistically significant difference.
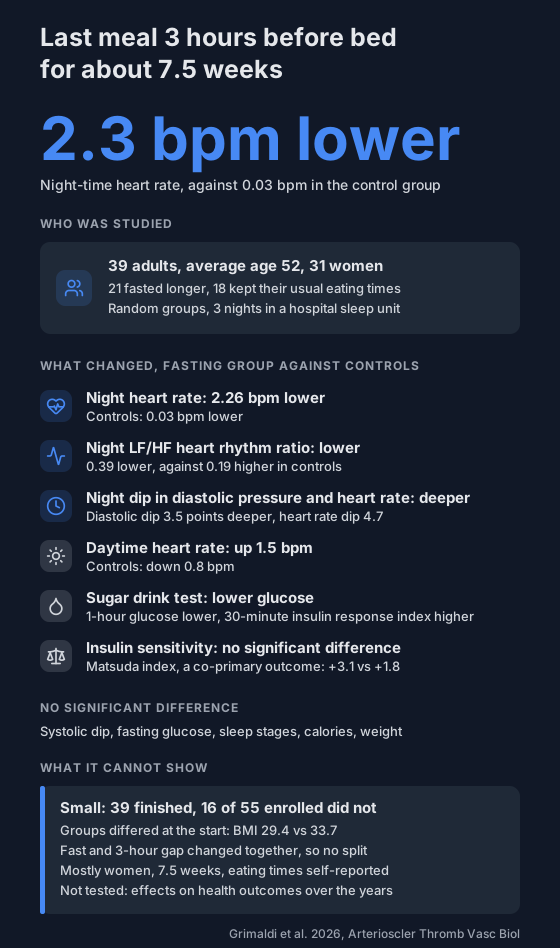
Many people stop eating a couple of hours before bed, and plenty don't. A 2026 trial from Northwestern University asked what happens to night-time heart rate and blood pressure when the last meal moves at least 3 hours before bed.
Short answer: heart rate was a little lower at night, and the night-time dip in diastolic blood pressure got deeper. The trial's other co-primary outcome, insulin sensitivity, showed no statistically significant difference.
Who was in the study?
- 39 adults, average age about 52, 31 of them women.
- They were overweight or had obesity (average BMI 29.4 in one group and 33.7 in the other) and had no diabetes.
- 55 people were enrolled and 39 finished: 21 in the fasting group and 18 in the control group.
- People with a known sleep disorder, or 30 or more breathing events an hour on a home recording, were left out.
- They were randomly assigned to one of two groups.
- Fasting group: add 3 hours to the usual overnight fast, with the last meal at least 3 hours before habitual bedtime. That meant a fast of 12 to 16 hours.
- Control group: keep eating at usual times, which was a fast of about 12 hours.
- Both groups dimmed the lights below 100 lux for the 3 hours before bed, and both were asked to keep their usual sleep, activity and calorie intake.
It ran for 6 weeks or more, 7.5 weeks on average. Before and after, everyone spent 3 nights in a hospital research unit with sleep recorded, hourly blood draws on one night and blood pressure measured every 30 minutes.
Did they stick to it?
By self-reported daily logs:
- The fasting group's average fast was 14 hours 51 minutes after the intervention, against 11 hours 50 minutes in the control group.
- Their last meal came 4 hours 24 minutes before bed on average, against 2 hours 41 minutes in the control group.
- Adherence to the assigned fast was 88%.
- The change in daily calories showed no statistically significant difference between the groups.
What happened at night?
All changes are from before to after the intervention, fasting group against control group.
- Heart rate: down 2.26 bpm in the fasting group and 0.03 bpm in the control group, from the hospital ECG. A 30-minute blood pressure monitor showed the same direction, down 1.8 bpm against 0.1 bpm.
- Heart rate variability: the LF/HF ratio, which the authors read as a balance between two parts of the nervous system, was 0.39 lower in the fasting group and 0.19 higher in controls.
- Night-time blood cortisol: 1.04 mcg/dL lower in the fasting group and 1.01 mcg/dL higher in controls.
- Diastolic blood pressure at night: down 1.8 mmHg in the fasting group and up 1.6 mmHg in controls.
- Systolic blood pressure at night: down 0.3 mmHg and up 1.5 mmHg, which was not a statistically significant difference.
What about the night-time dip?
Blood pressure and heart rate normally fall during sleep. The size of the fall is called the dip, and a dip under 10% is called non-dipping. The trial's co-primary outcome was the dip in blood pressure.
- Diastolic dip: 3.5 percentage points deeper in the fasting group, and 2.3 points shallower in controls.
- Heart rate dip: 4.7 points deeper in the fasting group, and 1.2 points shallower in controls.
- Systolic dip: no statistically significant difference.
The results section prints these changes with a minus sign for a deeper dip (-3.5% and +2.3% for diastolic, -4.7% and +1.2% for heart rate). The day and night readings agree with that reading: in the fasting group daytime values rose or held while night values fell.
- Non-dippers who became dippers: 4 of 6 fasting-group people for diastolic pressure and 7 of 11 for heart rate, against 0 of 3 and 2 of 8 in the control group. Those comparisons weren't statistically significant. The results text gives 8 control-group heart rate non-dippers, while the baseline table lists 9.
The heart rate dip got deeper partly because night-time heart rate fell and partly because daytime heart rate rose. Daytime heart rate went up 1.5 bpm in the fasting group and down 0.8 bpm in controls.
For background on why the dip matters, see oxygen burden and night-time blood pressure dipping.
What about blood sugar and sleep?
- Insulin sensitivity (Matsuda index): +3.1 in the fasting group and +1.8 in controls, no statistically significant difference (13 people per group). This was the second co-primary outcome. The authors suggest half the group had typical glucose tolerance, the study was small, and the index may not pick up changes well.
- Sugar drink test: average glucose fell 5.3 mg/dL in the fasting group and rose 4.9 mg/dL in controls. Glucose at 60 minutes was lower in the fasting group. The 30-minute insulin response index went up 0.3 in the fasting group and down 0.8 in controls, whose baseline value was about twice as high. Insulin at 30 minutes was lower in the fasting group than in controls.
- Fasting glucose, fasting insulin and HOMA-IR: no statistically significant difference.
- Sleep in the lab: no statistically significant difference in total sleep time, sleep efficiency, time awake after falling asleep, sleep stages or arousals.
- Weight: BMI change was not statistically different (p = 0.052).
What doesn't it tell you?
- A small trial. 16 of the 55 people enrolled didn't finish, and some measures cover fewer people. The night heart rate analysis had 15 and 13 people, the cortisol analysis 12 per group and the sugar drink test 13 per group.
- Groups that started unevenly. The fasting group had a lower BMI (29.4 against 33.7), 6 people with obesity against 13, and more blood pressure non-dippers. The authors say adjusting for BMI didn't change the results.
- Two changes at once. The fast was 3 hours longer and the last meal was at least 3 hours before bed. The study can't tell which part mattered.
- Lighting and routine. Both groups dimmed the lights, but the authors say other habits, such as activity, may have shifted with a set eating window.
- Who. Mostly women, eligible ages 35 to 75, none with diabetes or a sleep disorder.
- Many outcomes. The authors report unadjusted p-values across many related measures.
- Length. 7.5 weeks. It didn't follow heart or blood pressure outcomes over the years.
- How eating was recorded. Self-reported logs.
- Funding. The US National Institutes of Health funded it, and the authors report no conflicts of interest.
The authors link a deeper dip to lower long-term heart risk in other studies, but this trial didn't measure that. It's one trial and one measurement period per person.
What can you do with this?
If you wear an overnight oximeter, you already log night-time pulse. You can try your own comparison: log when you eat, then compare your lowest and average overnight pulse on early-meal and late-meal nights. Heart rate varies with alcohol, illness, heat and training, so use several nights of each, not one.
For more on how meal timing shows up in your data, see does a late dinner change overnight oxygen?. For what overnight pulse can show, see overnight heart rate and CVHR.
If you take blood pressure or diabetes medicines, or have a heart condition, talk to your doctor before changing when you eat.
Not a medical device. Does not diagnose, treat or prevent any condition. Discuss results and changes with a clinician.
References
- Grimaldi D, Reid KJ, Abbott SM, Knutson KL, Zee PC. Sleep-aligned extended overnight fasting improves nighttime and daytime cardiometabolic function. Arteriosclerosis, Thrombosis, and Vascular Biology. 2026;46(4):e323355. doi:10.1161/ATVBAHA.125.323355