Irregular Sleep and Death Risk: A US Study
A 2026 study of 7,604 US adults wearing wrist trackers found that each extra hour of night-to-night variation in sleep midpoint was linked to a 22% higher rate of death from any cause over about 7 years.
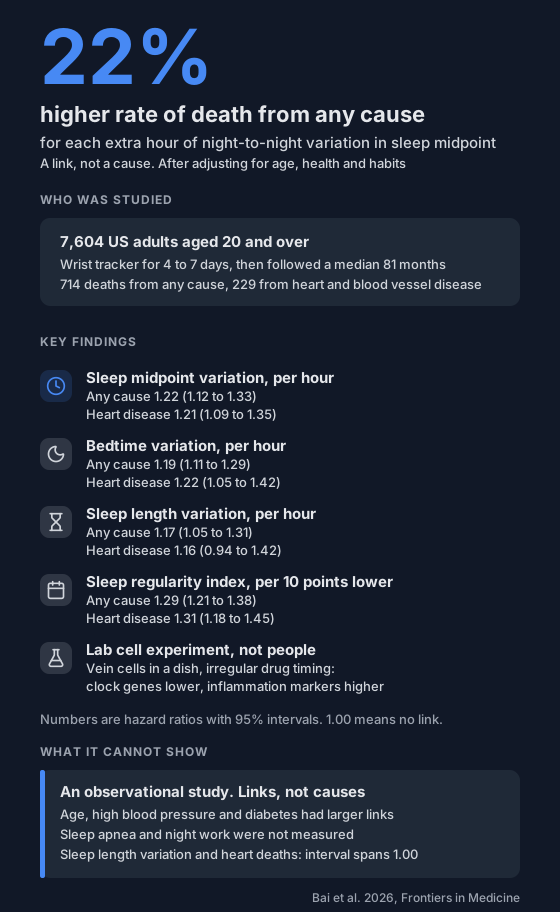
Plenty of research looks at how long you sleep. A 2026 study asked about something else: how much your sleep timing changes from night to night, and whether that lines up with who died over the following years.
What did the study find?
For death from any cause, the largest per-hour link was for sleep midpoint, the halfway point between falling asleep and waking. For each extra hour of night-to-night variation in the midpoint, the rate of death from any cause was 22% higher (hazard ratio 1.22, 95% interval 1.12 to 1.33). For death from heart and blood vessel disease it was 21% higher (1.21, 1.09 to 1.35).
The other measures, per extra hour of variation:
- Bedtime (sleep onset): 1.19 for any cause (1.11 to 1.29) and 1.22 for heart disease (1.05 to 1.42).
- Sleep length: 1.17 for any cause (1.05 to 1.31). For heart disease, 1.16 (0.94 to 1.42), which is not statistically significant. The authors say the small number of heart deaths limits what can be concluded.
A hazard ratio compares rates of death among people still alive at a given time. It is not the same as the chance of dying.
What about the sleep regularity index?
The study also used the sleep regularity index (SRI). It scores how closely your asleep and awake pattern at any minute matches the same minute 24 hours earlier, from -100 to 100. For each 10 points lower, the rate of death from any cause was 29% higher (1.21 to 1.38) and from heart disease 31% higher (1.18 to 1.45).
Average SRI was 61.96 across the cohort, and 65.8% scored below 70. Compared with an SRI of 80 or more, an SRI below 70 had a hazard ratio of 3.66 for any cause and 5.28 for heart disease. Only 17 deaths from any cause and 4 from heart disease were in the 80-plus group, so those intervals are very wide (1.91 to 7.02 and 1.77 to 15.68). The authors say these category figures do not set clinical thresholds.
How was it done?
- People: 7,604 US adults aged 20 and over from the 2011 to 2014 National Health and Nutrition Examination Survey (NHANES), a nationally representative survey.
- Tracking: a wrist accelerometer worn for up to 7 days. Everyone had at least 4 valid days, including at least 1 weekend day. Sleep and wake were estimated from movement.
- Variability: the standard deviation of each person's nightly sleep onset, midpoint and length across their valid nights.
- Follow-up: deaths were taken from the US National Death Index to the end of 2019. The median follow-up was 81 months, with 714 deaths from any cause and 229 from heart and blood vessel disease. Deaths from accidents were excluded.
- Adjustment: the main model adjusted for age, sex, race and ethnicity, education, marital status, income, smoking, alcohol, body mass index, high blood pressure and diabetes.
Was it a straight line?
The statistical tests found no evidence of a threshold. The curves rose gradually across the observed range.
The authors also tested a bedtime variation of more than 90 minutes. That group had a hazard ratio of 1.29 (1.05 to 1.59) for death from any cause. For heart disease the estimate was 1.23 (0.90 to 1.68), which is not statistically significant. The 90-minute cut-off came from an earlier study, not from this one.
Did it matter who you were?
Mostly the results pointed the same way across groups. Two differences held up after correcting for the number of tests, both by marital status for heart disease deaths: one for sleep midpoint and one for bedtime. For sleep midpoint, the link was 1.44 per standard deviation among married or partnered people and 1.01 among everyone else. The authors call the subgroup results exploratory and say they need repeating.
What was the lab experiment?
Alongside the cohort, the team ran a cell experiment. They exposed human umbilical vein cells, which line blood vessels, to a hormone-like drug (dexamethasone) that resets cellular clocks. Some dishes got it every 24 hours, and some on irregular 16 to 32 hour schedules. After 168 hours, the irregular dishes had lower expression of the clock genes BMAL1 and PER2 (about 0.44 and 0.47 of the regular level). They also had higher expression of inflammation and adhesion markers, from 1.92 times (TNF-α) to 2.80 times (ICAM-1) the regular level.
This was three runs in a dish. It shows differences between two drug schedules in these cells. It does not show that irregular sleep does the same in a person. The authors say the drug schedule is not the same as irregular sleep, and that the timing of sampling means some differences may reflect phase and not irregularity.
What can't it show?
- Cause. It is observational. It cannot show that irregular sleep leads to earlier death, and people with illness may sleep less regularly.
- Missing factors. The study did not measure sleep apnea, night work or depression, and the authors say these could explain some of the link.
- Size. Age, high blood pressure and diabetes had larger links than any sleep measure. The authors call sleep variability an additional marker, not a dominant predictor.
- Short tracking. One week of wrist movement can miss habits, and it does not measure sleep stages or breathing.
- No test of change. Whether making sleep more regular changes anything is not known. The authors say randomised trials are needed.
What can you do with it?
The study does not test any change in habits. If you're curious about your own pattern, you can log your sleep and wake times for a few weeks and see how much they move. For how the weekday and weekend gap relates to regularity, see social jetlag vs sleep regularity. For a smaller study of student athletes' sleep timing and heart rate variability, see irregular sleep timing and HRV.
If your sleep is erratic and you're worried about it, talk to your doctor.
Not a medical device. Does not diagnose, treat or prevent any condition. Discuss results and changes with a clinician.
References
- Bai J, Chen P, Cui C, Yang L. Night-to-night sleep variability and all-cause and cardiovascular mortality: a prospective cohort study with a complementary in vitro circadian-disruption experiment. Frontiers in Medicine. 2026;13:1917205. doi:10.3389/fmed.2026.1917205